Gold Price And Crude Oil Price Eyeing More Upsides
Gold price started a steady rise above the $1,700 and $1,710 levels. Similarly, crude oil price is showing positive signs and it could continue to rise above $28.00.
Important Takeaways for Gold and Oil
- Gold price gained traction and climbed above the $1,722 resistance against the US Dollar.
- There are two key bullish trend lines forming with support near $1,725 and $1,706 on the hourly chart of gold.
- Crude oil price is rising steadily and it could soon test the $30.00 resistance.
- There is a crucial bullish trend line forming with support near $26.00 on the hourly chart of XTI/USD.
Gold Price Technical Analysis
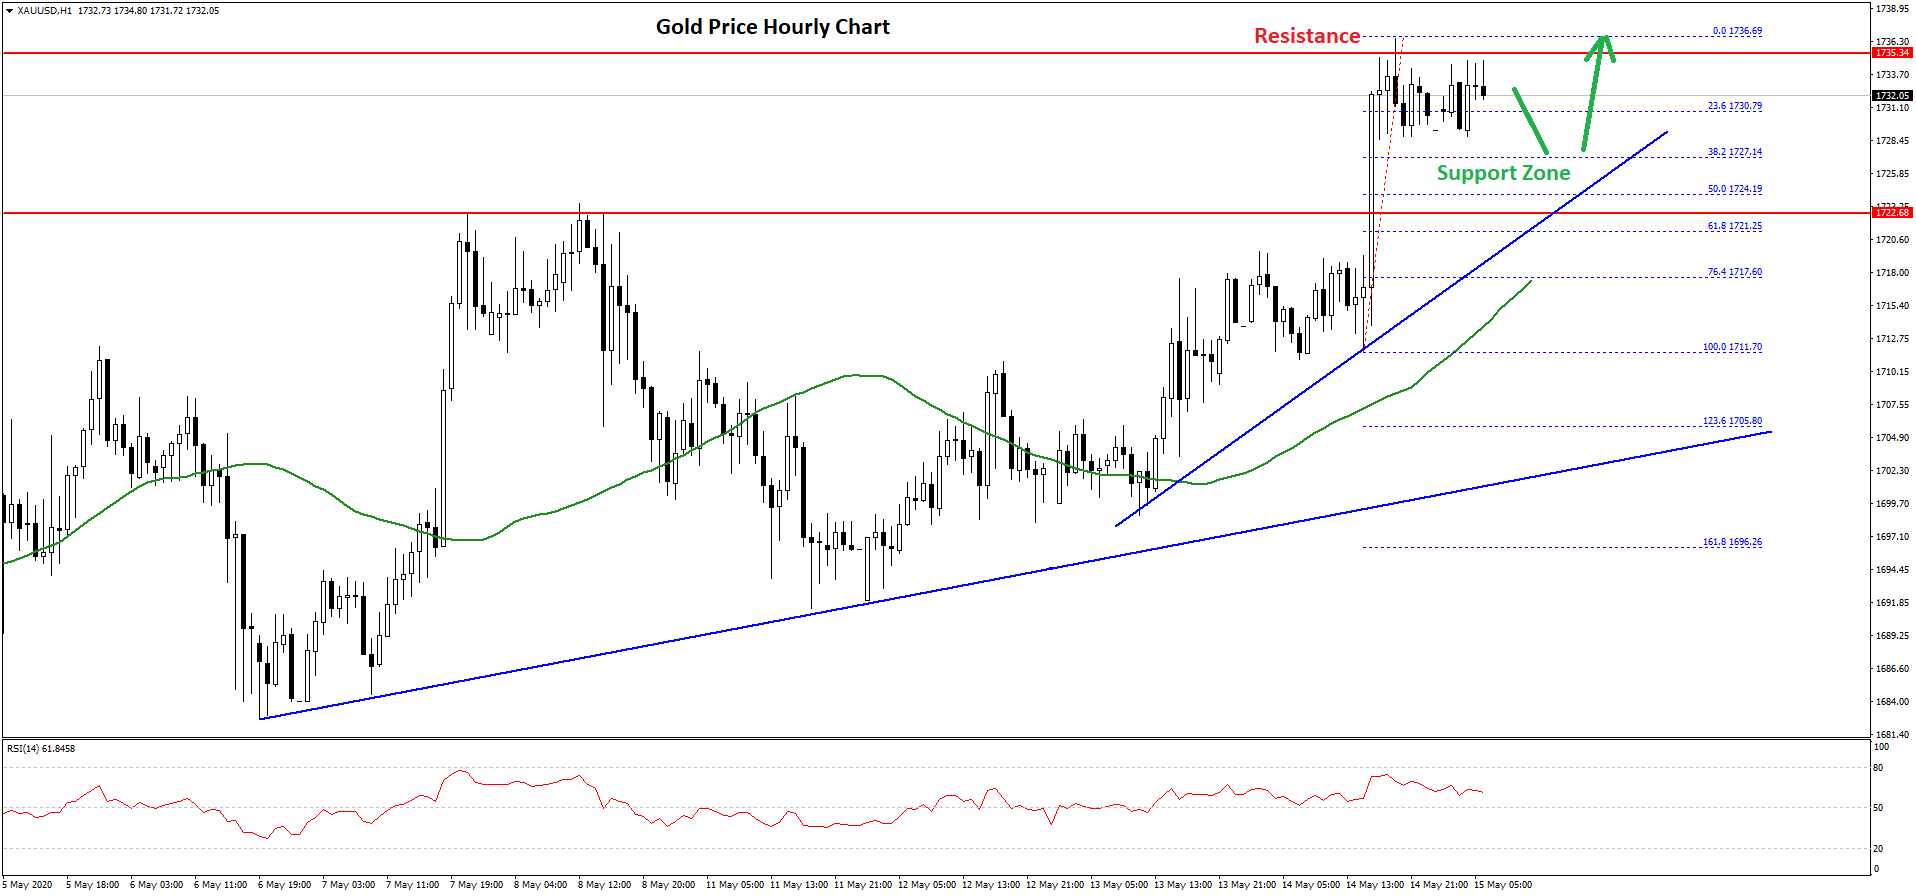
Gold price remained well bid above the $1,680 level and climbed above $1,700 against the US Dollar. There was a clear break above the $1,718 and $1,722 resistance levels to start a decent increase.
The price even settled above the $1,722 level and the 50 hourly simple moving average. It traded to a new weekly high at $1,736 on FXOpen and the price is currently consolidating gains.
It tested the 23.6% Fib retracement level of the recent rise from the $1,711 low to $1,736 high. On the downside, there are many supports forming near the $1,727 and $1,725 levels.
Moreover, there are two key bullish trend lines forming with support near $1,725 and $1,706 on the hourly chart of gold. The first trend line is close to the 50% Fib retracement level of the recent rise from the $1,711 low to $1,736 high.
If gold price fails to stay above the $1,725 support, it could decline towards the 50 hourly simple moving average or the second trend line at $1,706.
On the upside, an initial resistance is near the $1,735 level. A successful break above the recent high might open the doors for a move towards the $1,750 level in the near term.
Oil Price Technical Analysis
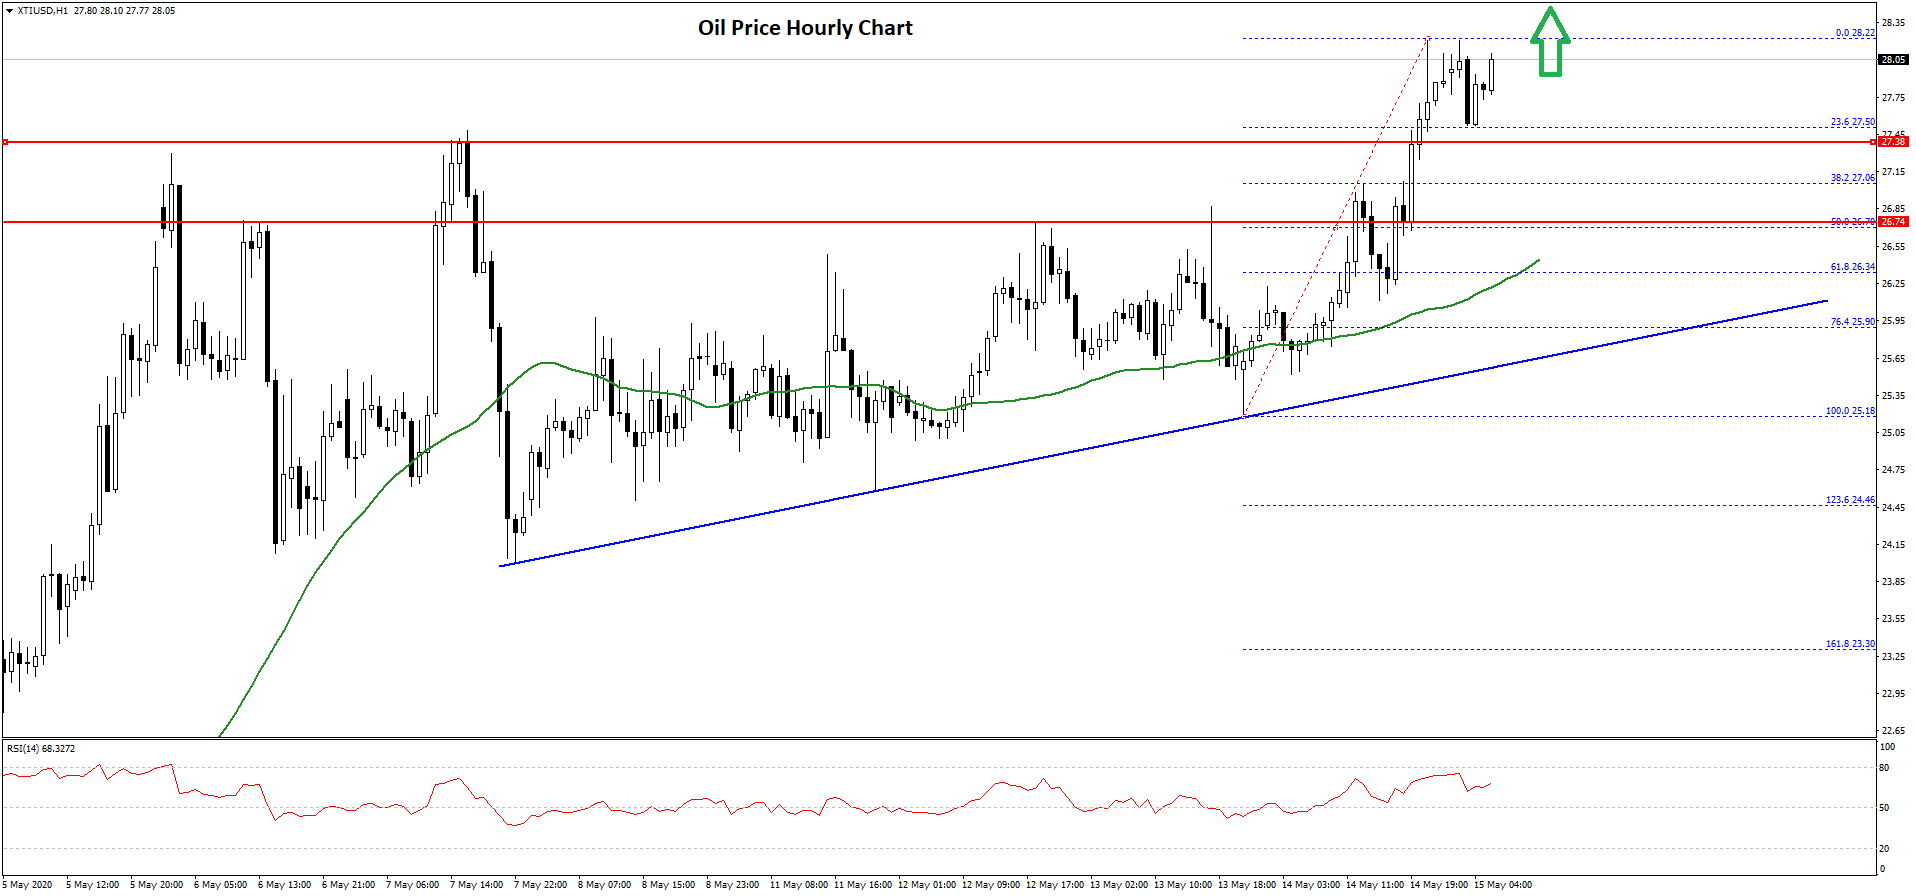
Crude oil price consolidated above the $25.00 support for a few sessions before extending its rise against the US Dollar. The price gained traction and broke the $26.50 and $26.75 resistance levels.
Besides, there was a close above the $27.50 resistance area and the 50 hourly simple moving average. It even climbed above the $28.00 level and traded as high as $28.22.
It is currently consolidating gains and recently tested the 23.6% Fib retracement level of the upward move from the $25.18 low to $28.22 high. On the downside, the first key support is seen near the $27.40 level.
The next major support is near the $26.75 level (the previous breakout zone). It is close to the 50% Fib retracement level of the upward move from the $25.18 low to $28.22 high.
More importantly, there is a crucial bullish trend line forming with support near $26.00 on the hourly chart of XTI/USD. An intermediate support is near the $26.35 level and the 50 hourly SMA.
Therefore, dips are likely to remain well supported near $26.75 and $26.35. To move into a bearish zone, the price must move below the $26.00 support. Conversely, oil price might continue to rise above $28.00 and $28.500.
The next major resistance on the upside is near the $30.00 level, above which it could test $31.20.