Gold Price And Crude Oil Price Facing Hurdles
Gold price is gaining momentum above the $1,550 level, but it is facing hurdles. Similarly, crude oil price is facing a strong hurdle near the $51.80 and $52.00 levels.
Important Takeaways for Gold and Oil
- Gold price started a decent upward move from the $1,547 swing low against the US Dollar.
- There was a break above a key bearish trend line with resistance near $1,565 on the hourly chart of gold.
- Crude oil price is holding the key $50.00 and $50.40 support levels.
- There is a key bearish trend line forming with resistance near $51.80 on the hourly chart of XTI/USD.
Gold Price Technical Analysis
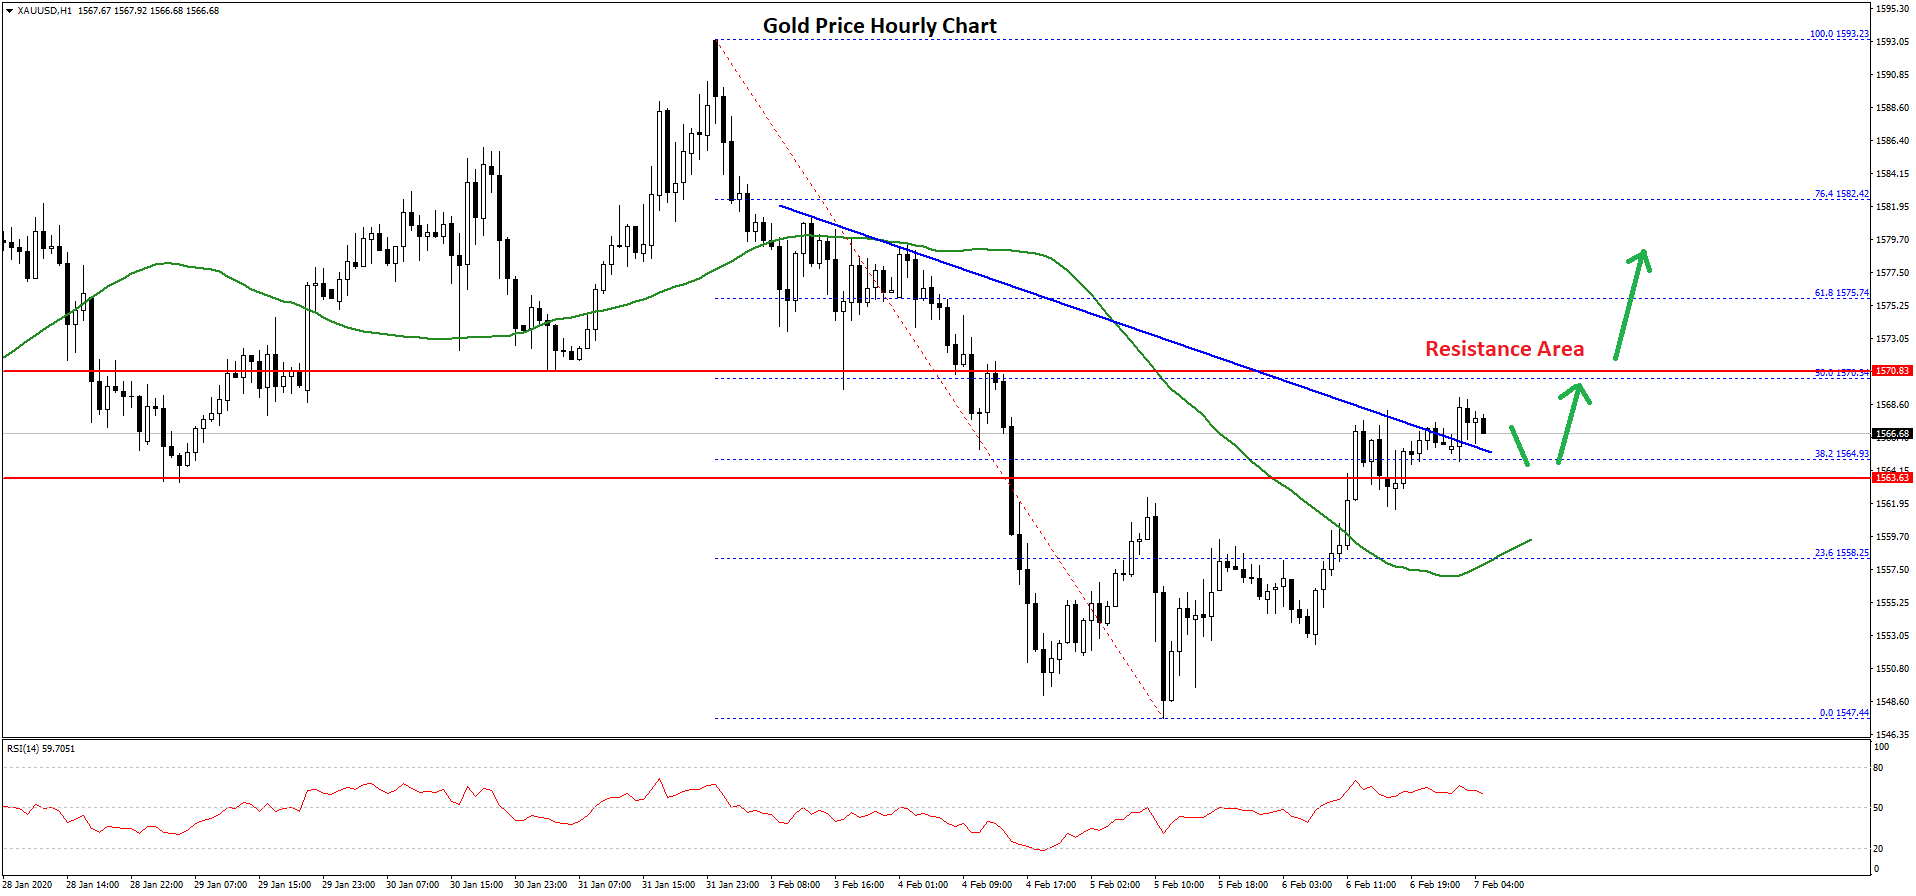
After a strong decline, gold price found support near the $1,547 and $1,548 levels against the US Dollar. A support base was formed above $1,545 and the price started a decent upward move from the $1,547 low (formed on FXOpen).
It broke the $1,550 and $1,555 resistance levels. Moreover, there was a close above the $1,560 level and the 50 hourly simple moving average.
More importantly, there was a break above a key bearish trend line with resistance near $1,565 on the hourly chart of gold. The price even climbed above the 23.6% Fib retracement level of the downward move from the $1,593 high to $1,547 low.
On the upside, there is a strong resistance waiting near the $1,570 level. It coincides with the 50% Fib retracement level of the downward move from the $1,593 high to $1,547 low.
A clear break above the $1,570 resistance area could set the pace for more gains in the coming sessions. The next hurdle is seen near the $1,575 and $1,582 levels.
Any further gains could lead the price towards the $1,590 level. On the downside, an initial support is near the $1,562 level (the recent breakout zone). The main support is near the $1,560 level and the 50 hourly simple moving average.
Overall, gold price is trading nicely above $1,560, but it must surpass $1,570 to continue higher in the near term.
Oil Price Technical Analysis
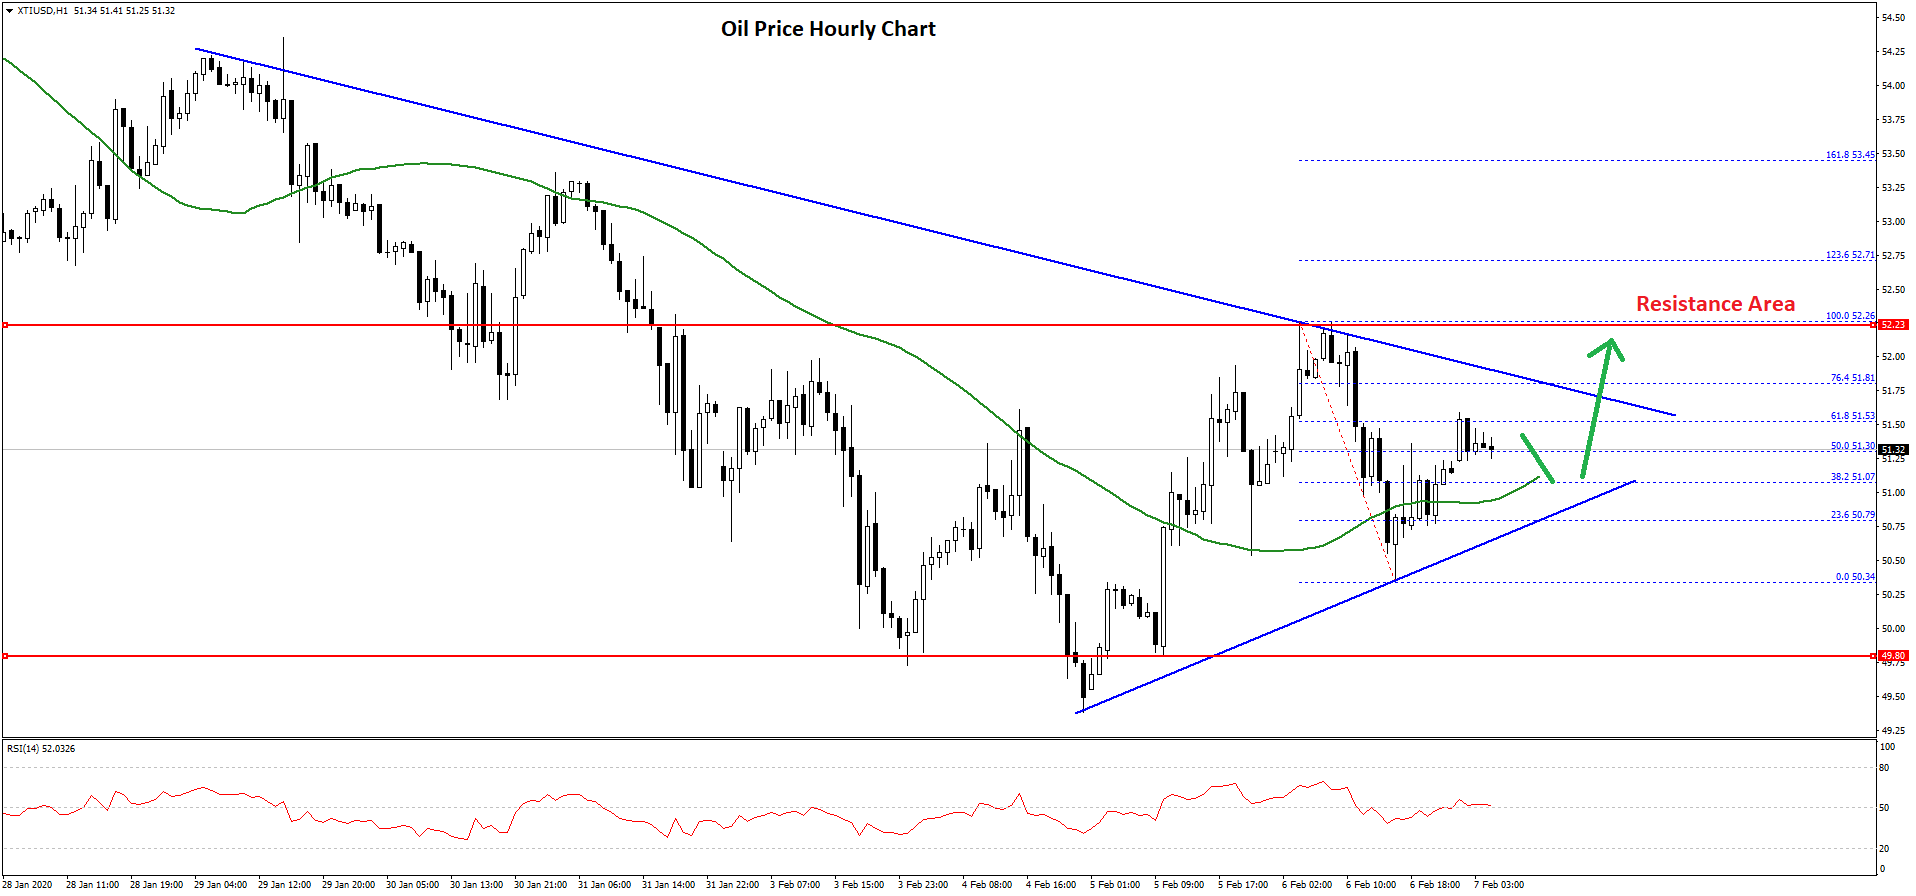
In the past few days, there was a steady decline in crude oil price below the $55.00 support level against the US Dollar. The price traded below many key supports near the $52.50 and $52.00 levels.
It even broke the $50.00 support level and traded towards the $49.40 level. A low is formed near $49.38 and the price is currently recovering higher.
It surpassed the $50.50 resistance area and the 50 hourly simple moving average. Recently, it climbed above $51.50, but it struggled to gain pace above $52.25. It trimmed gains and revisited the $50.50 zone.
A low is formed near $50.34 and the price is currently rising. It is trading above the 50% Fib retracement level of the recent decline from the $52.26 high to $50.34 low.
However, there are many hurdles on the upside near $51.50 and $52.00. Besides, there is a key bearish trend line forming with resistance near $51.80 on the hourly chart of XTI/USD.
The trend line is close to the 76.4% Fib retracement level of the recent decline from the $52.26 high to $50.34 low. Therefore, crude oil price must climb above the $51.80 and $52.25 resistance levels to continue higher. If not, it might retest the $50.00 support area.