Gold Price And Crude Oil Price Facing Key Hurdles
Gold price remained in a strong uptrend and traded above the $1,750 level before correcting lower. Similarly, crude oil price started a strong increase and climbed above $30.00.
Important Takeaways for Gold and Oil
- Gold price traded as high as $1,764 before correcting lower against the US Dollar.
- There is a key resistance trend line forming with the current hurdle at $1,775 on the daily chart of gold.
- Crude oil price followed a strong bullish path and traded above $25.00 and $30.00.
- There was a break above a key bearish trend line with resistance near $26.50 on the daily chart of XTI/USD.
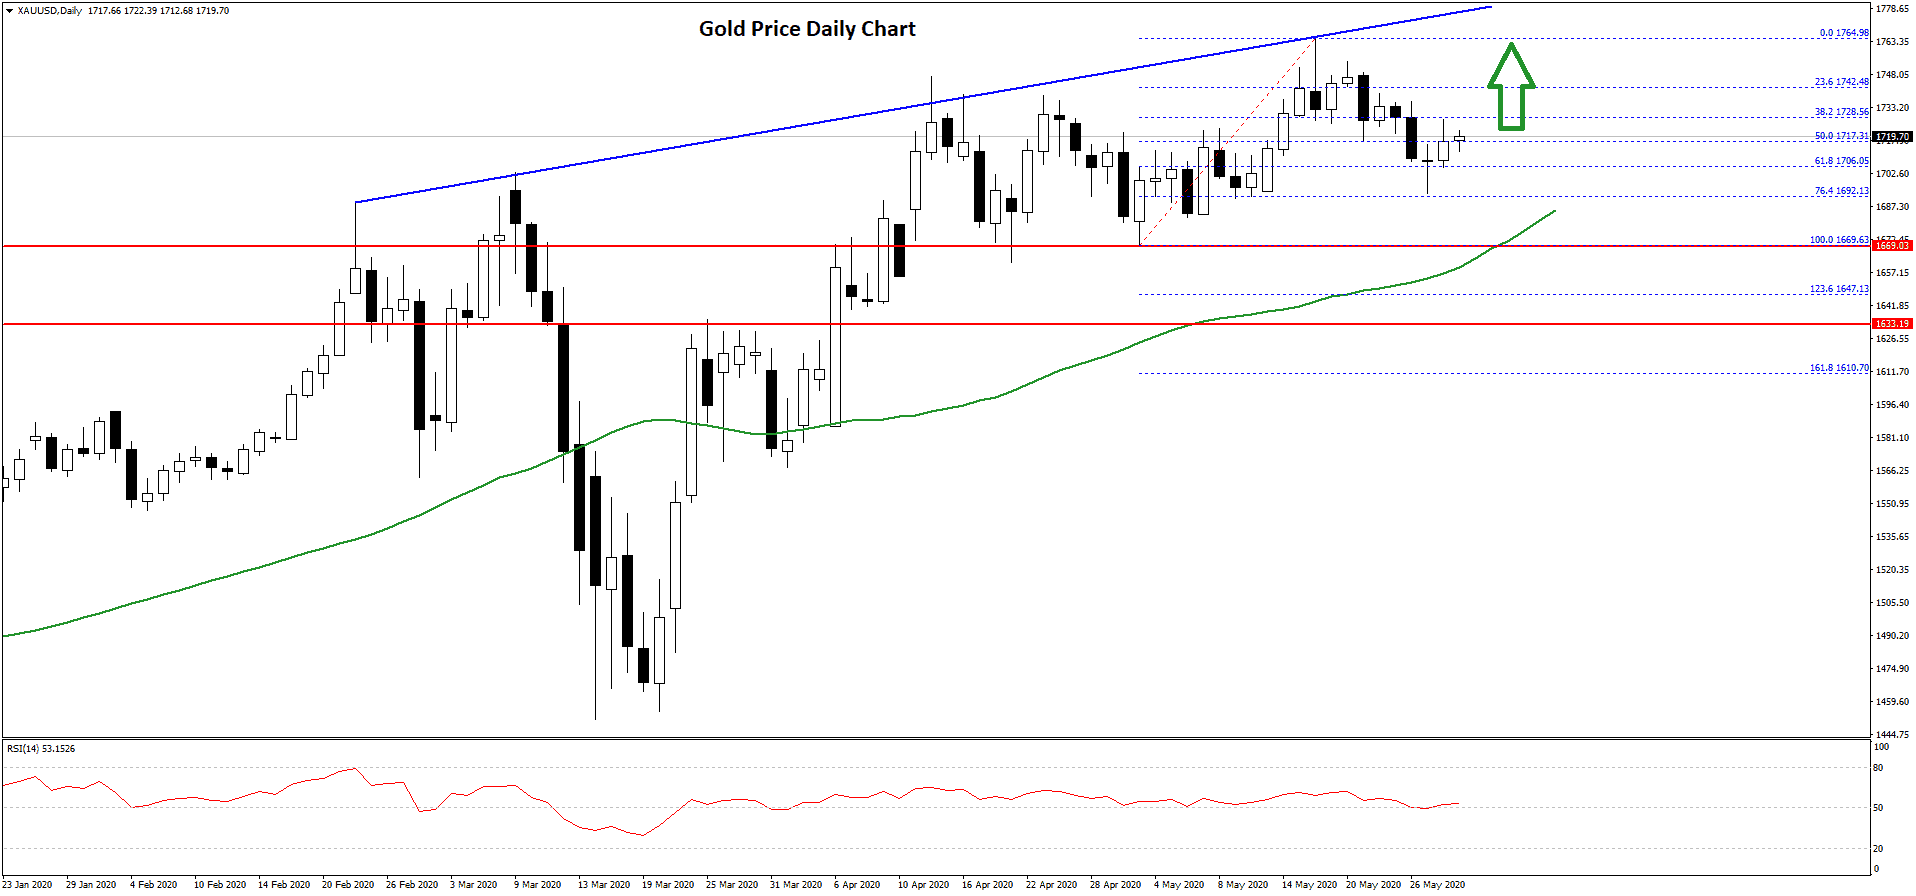
Gold Price Technical Analysis
Gold price remained in a bullish zone above the $1,700 resistance zone against the US Dollar. There was a clear break above the $1,725 and $1,750 resistance levels.
The price traded to a new yearly high at $1.764 on FXOpen and settled well above the 50-day simple moving average. Recently, there was a downside correction from the $1,764 high.
The bears pushed the price below the $1,750 level. It even broke the 50% Fib retracement level of the upward move from the $1,669 low to $1,764 high. However, the decline was protected by the $1,690 level.
It seems like the price found support near the 76.4% Fib retracement level of the upward move from the $1,669 low to $1,764 high. The next major support on the downside is near the $1,685 level and the 50-day simple moving average.
Any further losses may perhaps open the doors for a larger decline towards the $1,650 and $1,640 levels in the near term. On the upside, an initial resistance is near the $1,740 level.
The first major resistance is near the $1,765 level. There is also a key resistance trend line forming with the current hurdle at $1,775 on the daily chart of gold. Any further gains could lead gold price towards the $1,800 level.
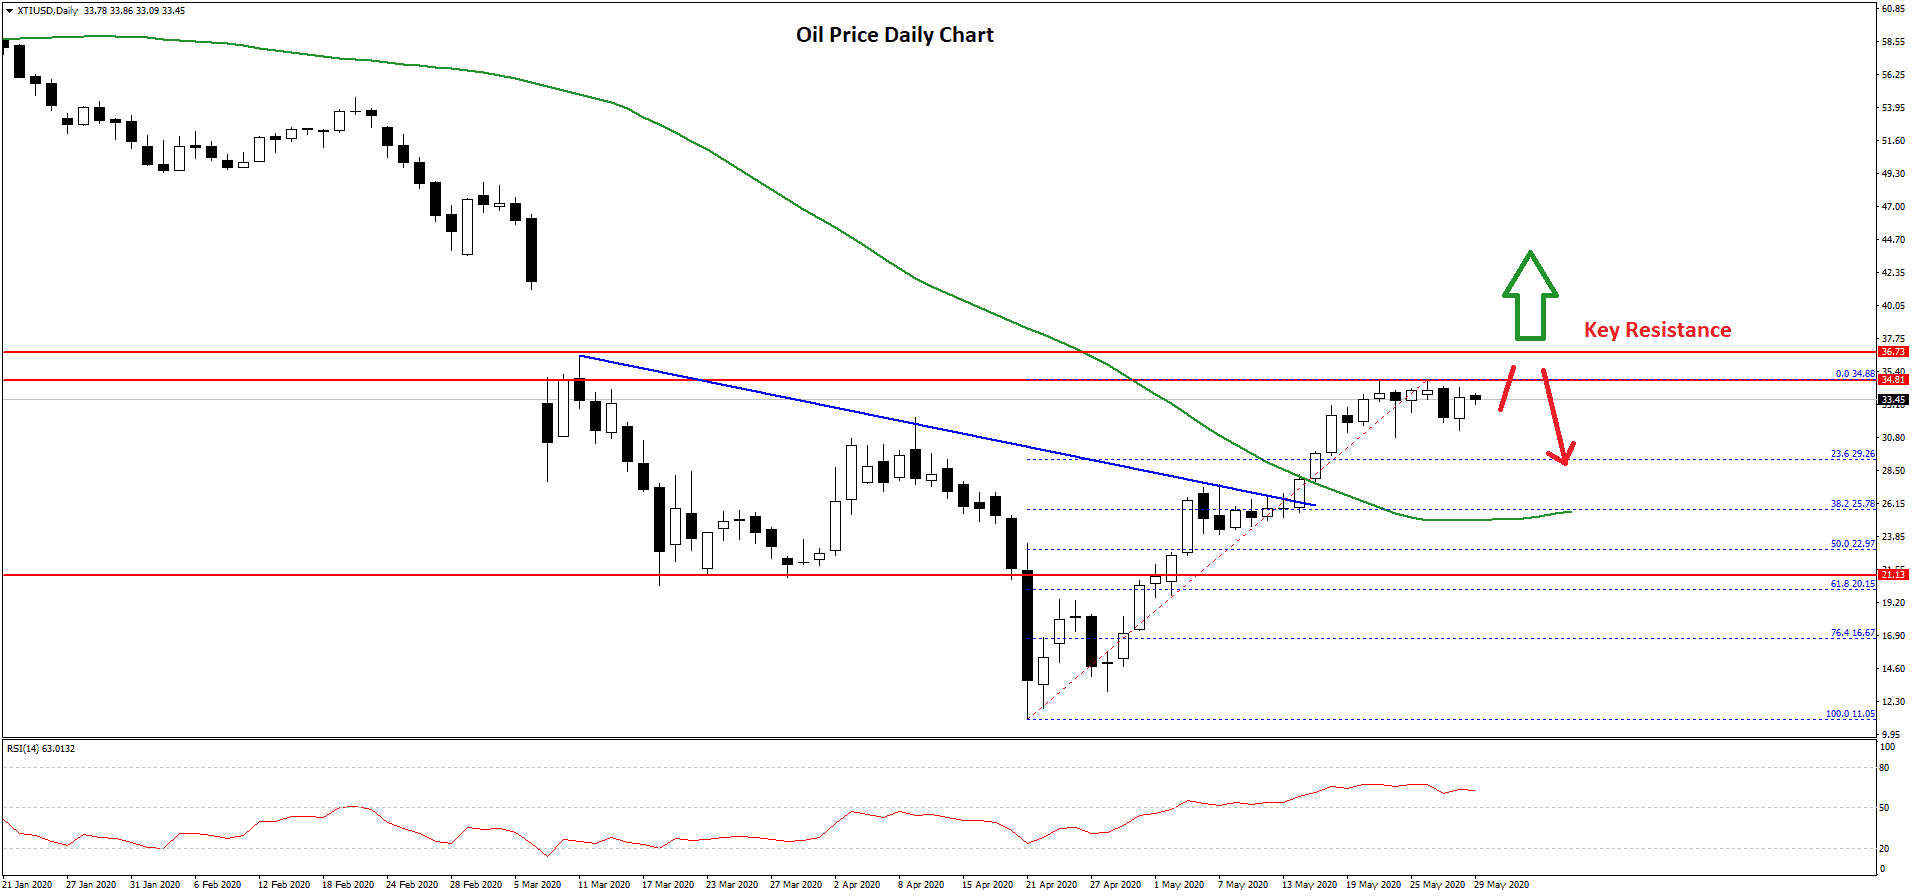
Oil Price Technical Analysis
Crude oil price started a strong increase after it settled above the $20.00 level against the US Dollar. The price gained traction and broke the $25.00 and $28.00 resistance levels.
Besides, there was a close above the $30.00 resistance area and the 50-day simple moving average. During the rise, there was a break above a key bearish trend line with resistance near $26.50 on the daily chart of XTI/USD.
It climbed towards the main $35.00 resistance area, where sellers appeared. It is currently consolidating gains, with an immediate support near the 23.6% Fib retracement level of the upward move from the $11.05 low to $34.88 high.
On the downside, the first key support is seen near the $25.75 level and the 50-day simple moving average. The next major support is near the $23.00 zone since it is close to the 50% Fib retracement level of the upward move from the $11.05 low to $34.88 high.
Overall, there are many supports on the downside, starting with $30.00 and up to $23.00. On the upside, the bulls need to gain traction above the $35.00 resistance for more gains.
The next major resistance on the upside is near the $36.75 level, above which it could test $38.00 in the near term.