Gold Price And Crude Oil Price Likely To Rise Further
Gold price is trading nicely in a positive zone above the $1,475 support area. Crude oil price is also showing positive signs and it could continue to rise above $59.00 and $60.00.
Important Takeaways for Gold and Oil
- Gold price rallied recently above the $1,460 and $1,475 resistance levels against the US Dollar.
- There is a contracting triangle forming with resistance near $1,478 on the hourly chart of gold.
- Crude oil price remains well supported above the $57.00 and $57.60 levels.
- There was a break above a major bearish trend line with resistance near $57.15 on the hourly chart of XTI/USD.
Gold Price Technical Analysis
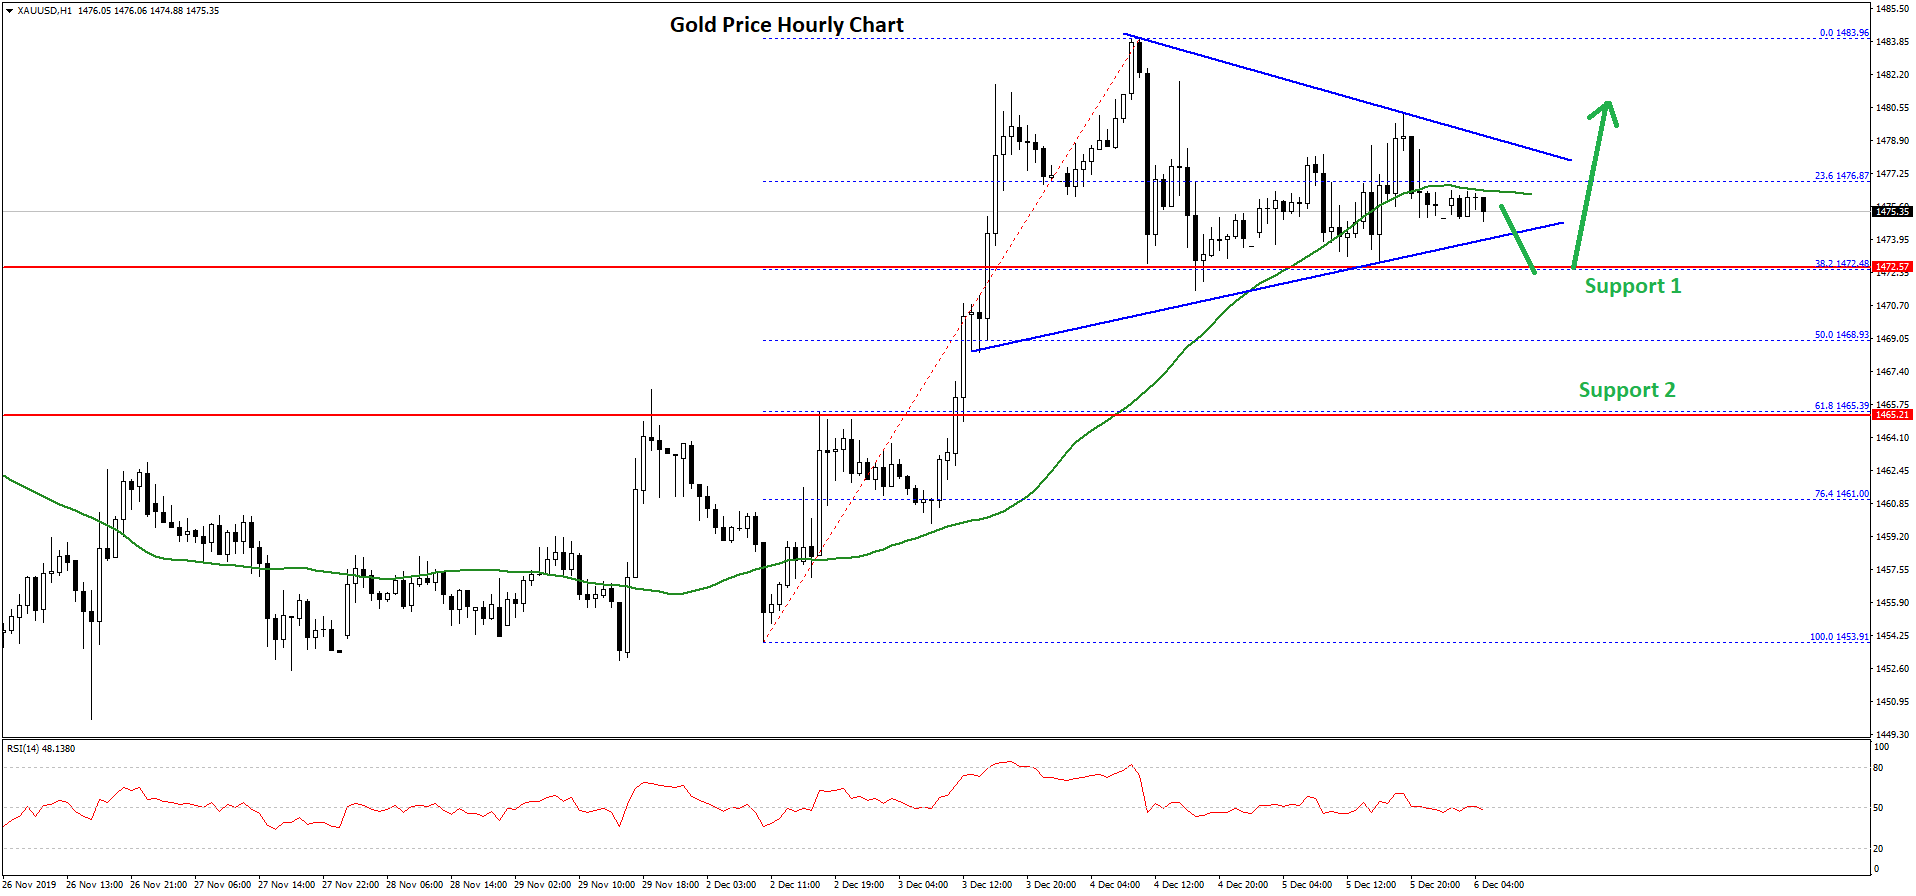
Earlier this week, gold price formed a strong support near the $1,452 and $1,453 levels against the US Dollar. As a result, there was a nice upward move above the $1,460 and $1,470 resistance levels.
Moreover, there was a break below the $1,475 resistance and 50 hourly simple moving average. Finally, there was a break above the $1,480 level and the price traded as high as $1,483 on FXOpen.
Recently, there was a downside correction below the $1,480 and $1,478 levels. The price traded below the 23.6% Fib retracement level of the upward move from the $1,453 low to $1,483 high.
However, the price is holding the $1,472 and $1,470 support levels. Besides, it seems like the 38.2% Fib retracement level of the upward move from the $1,453 low to $1,483 high is providing support.
More importantly, there is a contracting triangle forming with resistance near $1,478 on the hourly chart of gold. If there is an upside break above the $1,478 and $1,480 resistance levels, the price is likely to continue higher.
The next major resistance is near the $1,485 level, above which gold price may perhaps rise towards the $1,500 level in the near term.
On the downside, an initial support is near the $1,472 level. If gold price fails to stay above the $1,472 support, there are chances of a push towards the $1,465 support area.
Oil Price Technical Analysis
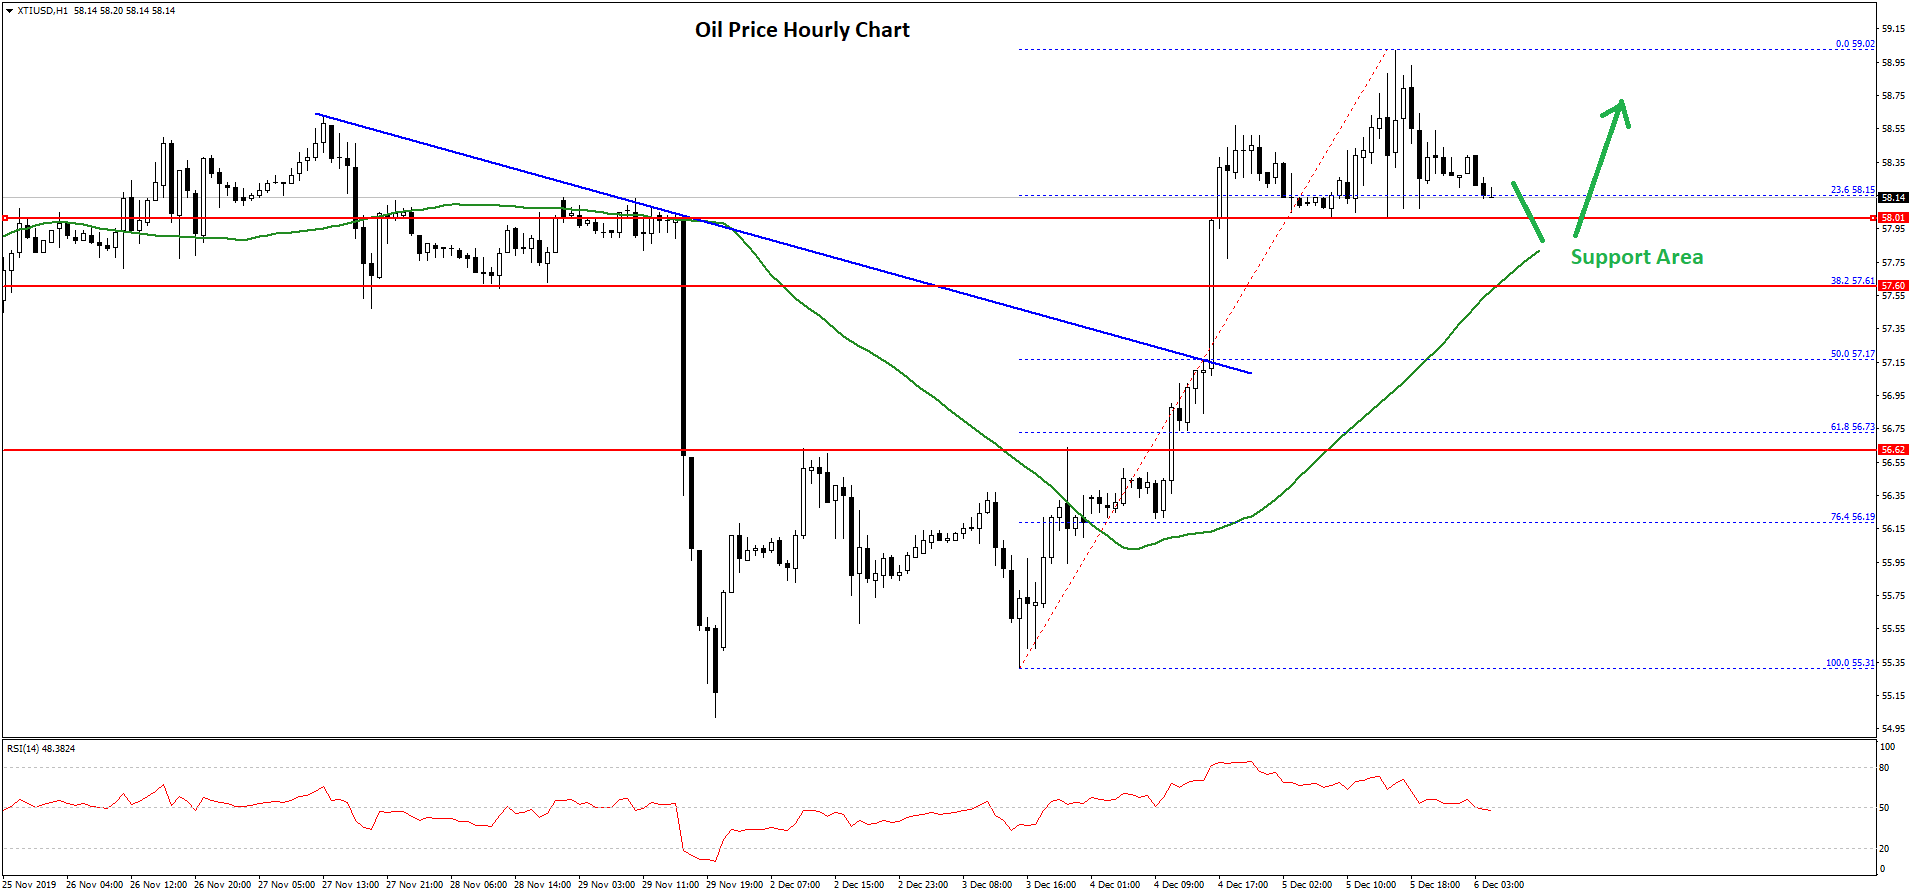
This week, there was a nice upward move in crude oil price from the $55.40 support area against the US Dollar. The price even climbed above the $56.50 resistance area to move into a positive zone.
Furthermore, there was a break above the $57.00 hurdle and the 50 hourly simple moving average. More importantly, there was a break above a major bearish trend line with resistance near $57.15 on the hourly chart of XTI/USD.
It opened the doors for more gains above the $58.00 level. The price traded as high as $56.02 and it is currently correcting lower. It is testing the 23.6% Fib retracement level of the recent wave from the $55.31 low to $59.02 high.
On the downside, there are many supports near $57.75, $57.70 and $57.60. The 50 hourly simple moving average is also near the $57.75 level.
Besides, the 38.2% Fib retracement level of the recent wave from the $55.31 low to $59.02 high is near $57.17. If there are more downsides, the price could revisit the $57.00 support area.
Conversely, crude oil price could resume its upward move above the $58.50 and $59.00 resistance levels in the near term.