Gold Price And Crude Oil Price Rally Could Extend
Gold price rallied recently above the $1,520 and $1,530 resistance levels. Crude oil price is also rising and it could continue to climb higher towards the $64.00 resistance.
Important Takeaways for Gold and Oil
- Gold price surged in the past few days and recently tested $1,540 against the US Dollar.
- There is a key bullish trend line forming with support near $1,532 on the hourly chart of gold.
- Crude oil price spiked recently above the $62.00 resistance area.
- There was a break above a major bearish trend line with resistance near $61.05 on the hourly chart of XTI/USD.
Gold Price Technical Analysis
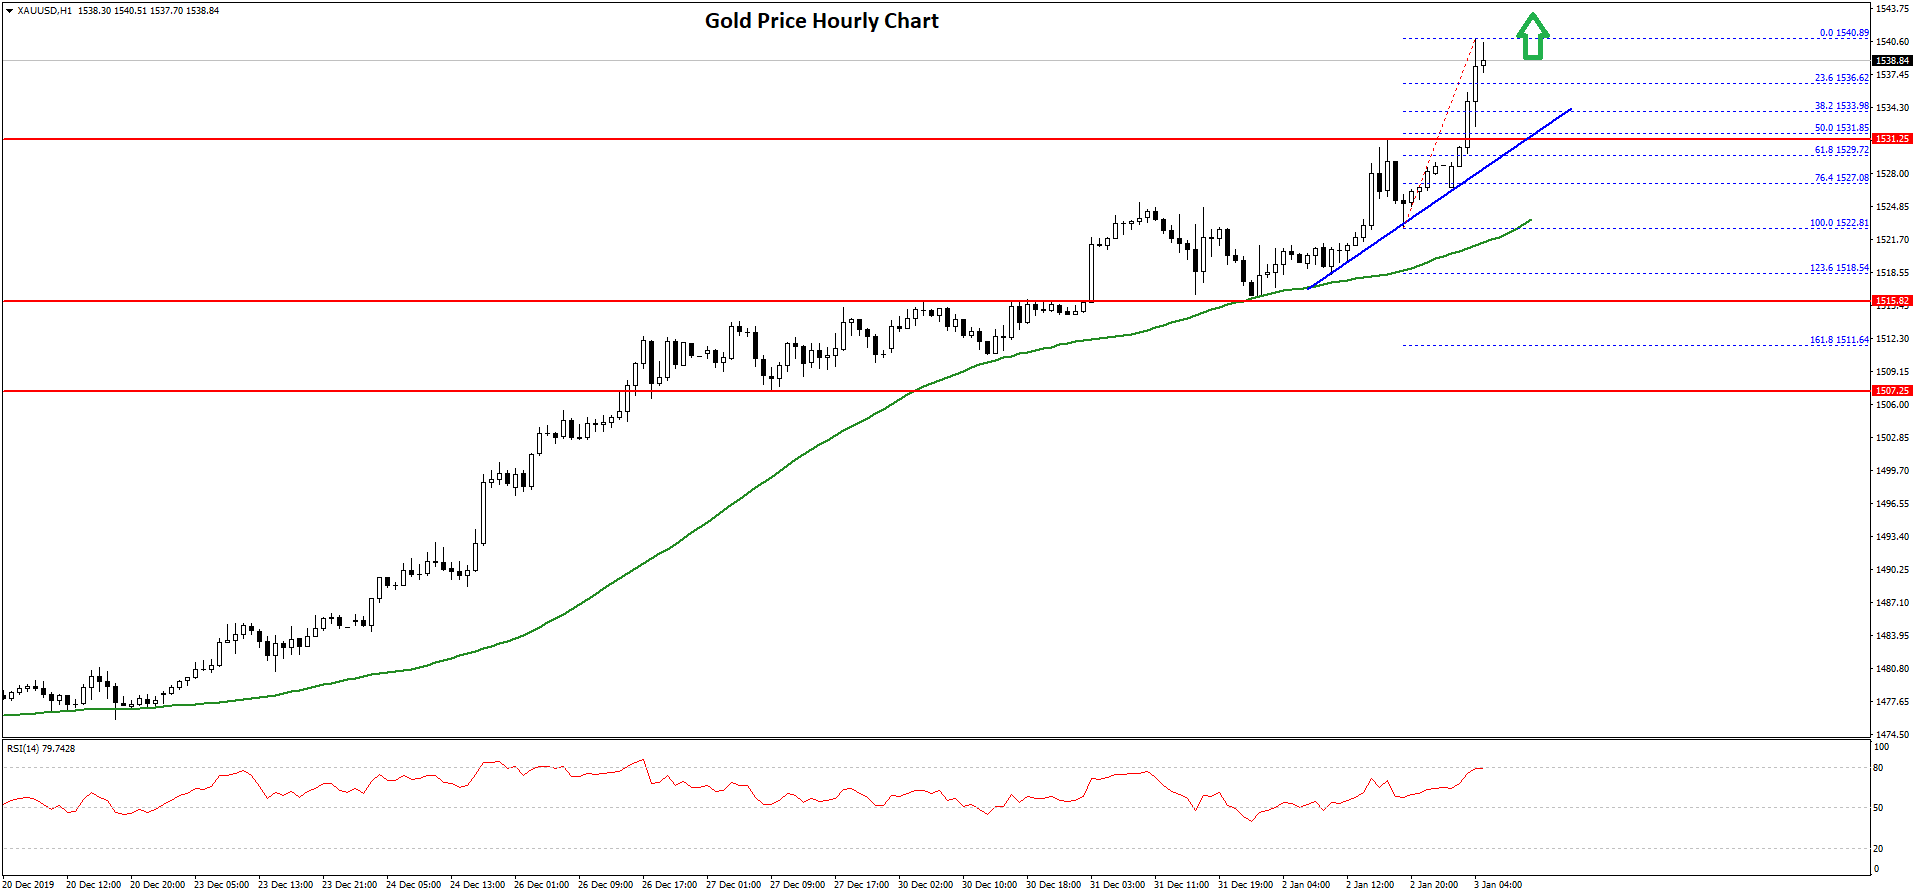
In the past few days, gold price remained in a strong uptrend above the $1,500 level against the US Dollar. The price even broke the key $1,520 resistance area to continue higher.
Moreover, there was a close above the $1,520 level and the 50 hourly simple moving average. The price recently traded to a new 2020 high at $1,540 on FXOpen and it is still showing a lot of positive signs.
An initial support is near the $1,536 level. It coincides with the 23.6% Fib retracement level of the upward move from the $1,522 low to $1,540 high.
The main support on the downside is near the $1,532 level. Besides, there is a key bullish trend line forming with support near $1,532 on the hourly chart of gold.
The trend line coincides with the 50% Fib retracement level of the upward move from the $1,522 low to $1,540 high. If there is a downside break below the trend line, the price might correct lower towards the $1,525 and $1,520 support levels.
On the upside, an immediate resistance is near the $1,540 level, above which gold price might climb towards the $1,545 level. Any further gains could lead the price towards the $1,550 resistance area in the near term.
Oil Price Technical Analysis
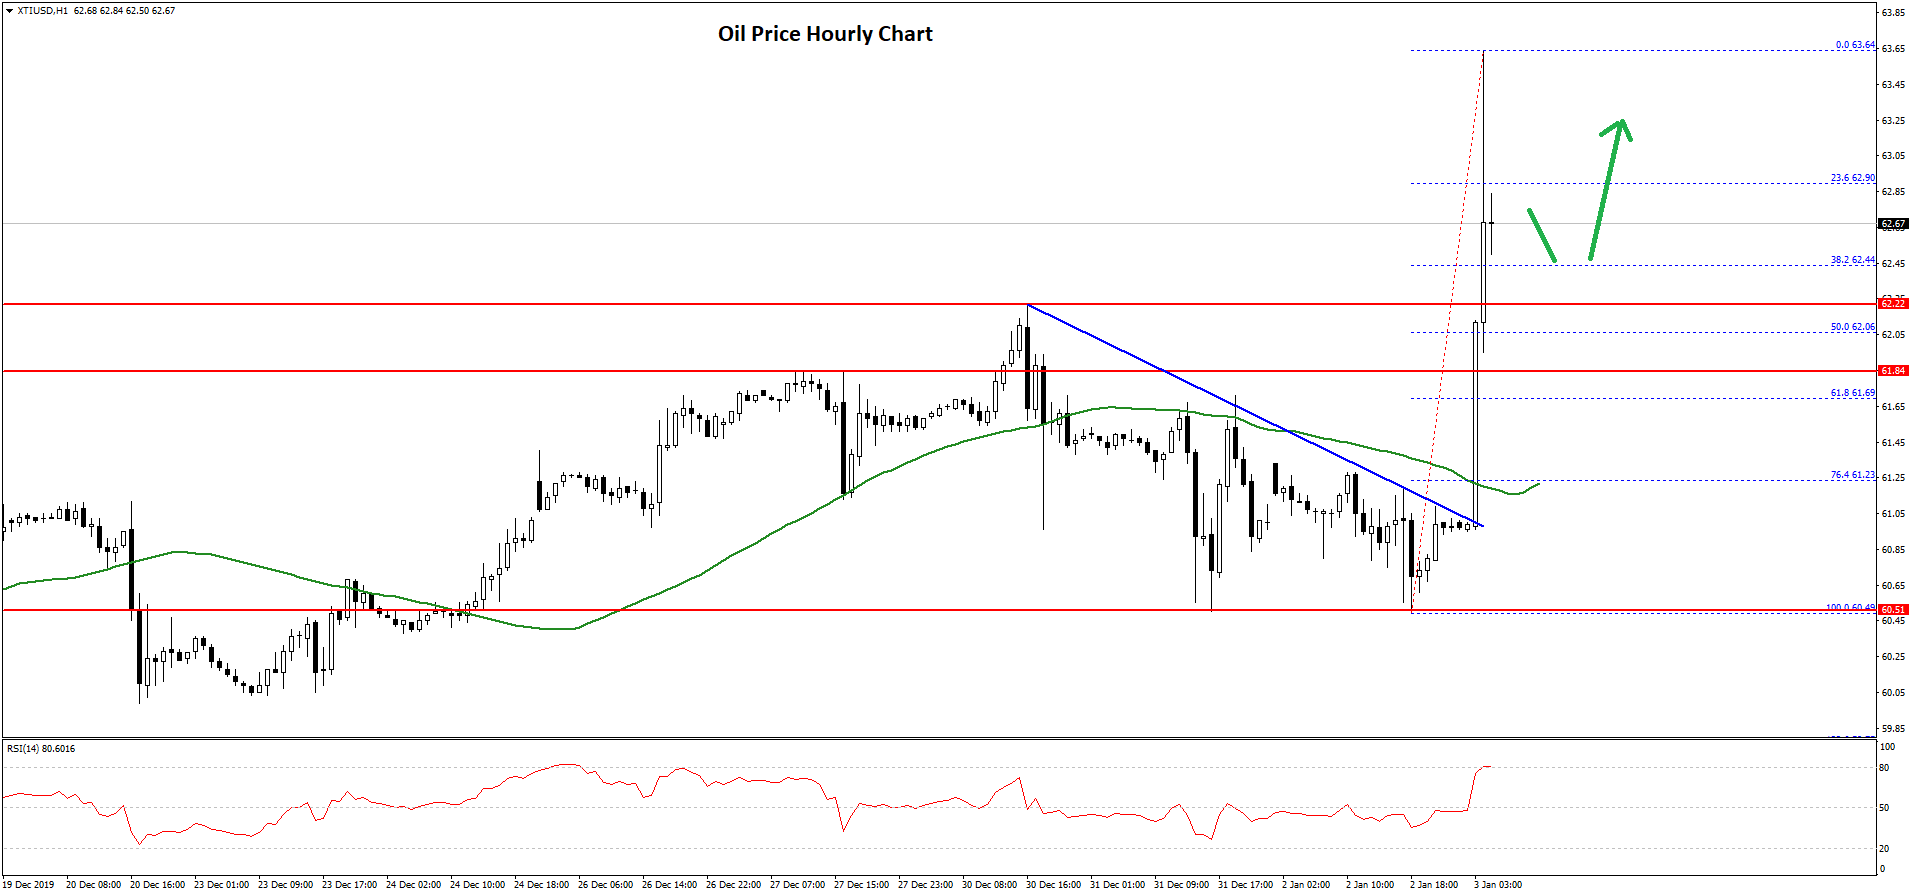
In the past few days, crude oil price consolidated above the $60.00 support against the US Dollar. Finally, the bulls took control and they were able to push the price above the $61.00 and $62.00 resistance levels.
Besides, there was a break above a major bearish trend line with resistance near $61.05 on the hourly chart of XTI/USD. The price spiked above the $63.00 resistance area and settled above the 50 hourly simple moving average.
It traded as high as $63.64 recently and it is currently correcting lower. It is trading below the 23.6% Fib retracement level of the recent rally from the $60.49 low to $63.64 high.
On the downside, there are many supports near $62.20 and $62.00. Moreover, the 50% Fib retracement level of the recent rally from the $60.49 low to $63.64 high is near the $62.00 area to protect the decline.
Any further losses may perhaps lead the price back towards the $61.20 support and the 50 hourly simple moving average. The next major support is near the $60.20 and $60.00 levels.
Conversely, crude oil price could continue to climb higher above $62.80 and $63.00. The main hurdle is near the $63.50 level, above which there are high chances of a push towards the $64.50 and $65.00 resistance levels in the near term.