Gold Price and Crude Oil Price Show Bearish Signs
Gold price started a fresh decline from well above $1,825. Crude oil price is also declining and it broke the main $70.00 support zone.
Important Takeaways for Gold and Oil
- Gold price failed to clear the $1,830 level and it started a fresh decline against the US Dollar.
- There was a break below a major bullish trend line with support near $1,815 on the hourly chart of gold.
- Crude oil price also started a fresh decline from well above the $72.00 zone.
- There is a connecting bearish trend line forming with resistance near $69.25 on the hourly chart of XTI/USD.
Gold Price Technical Analysis
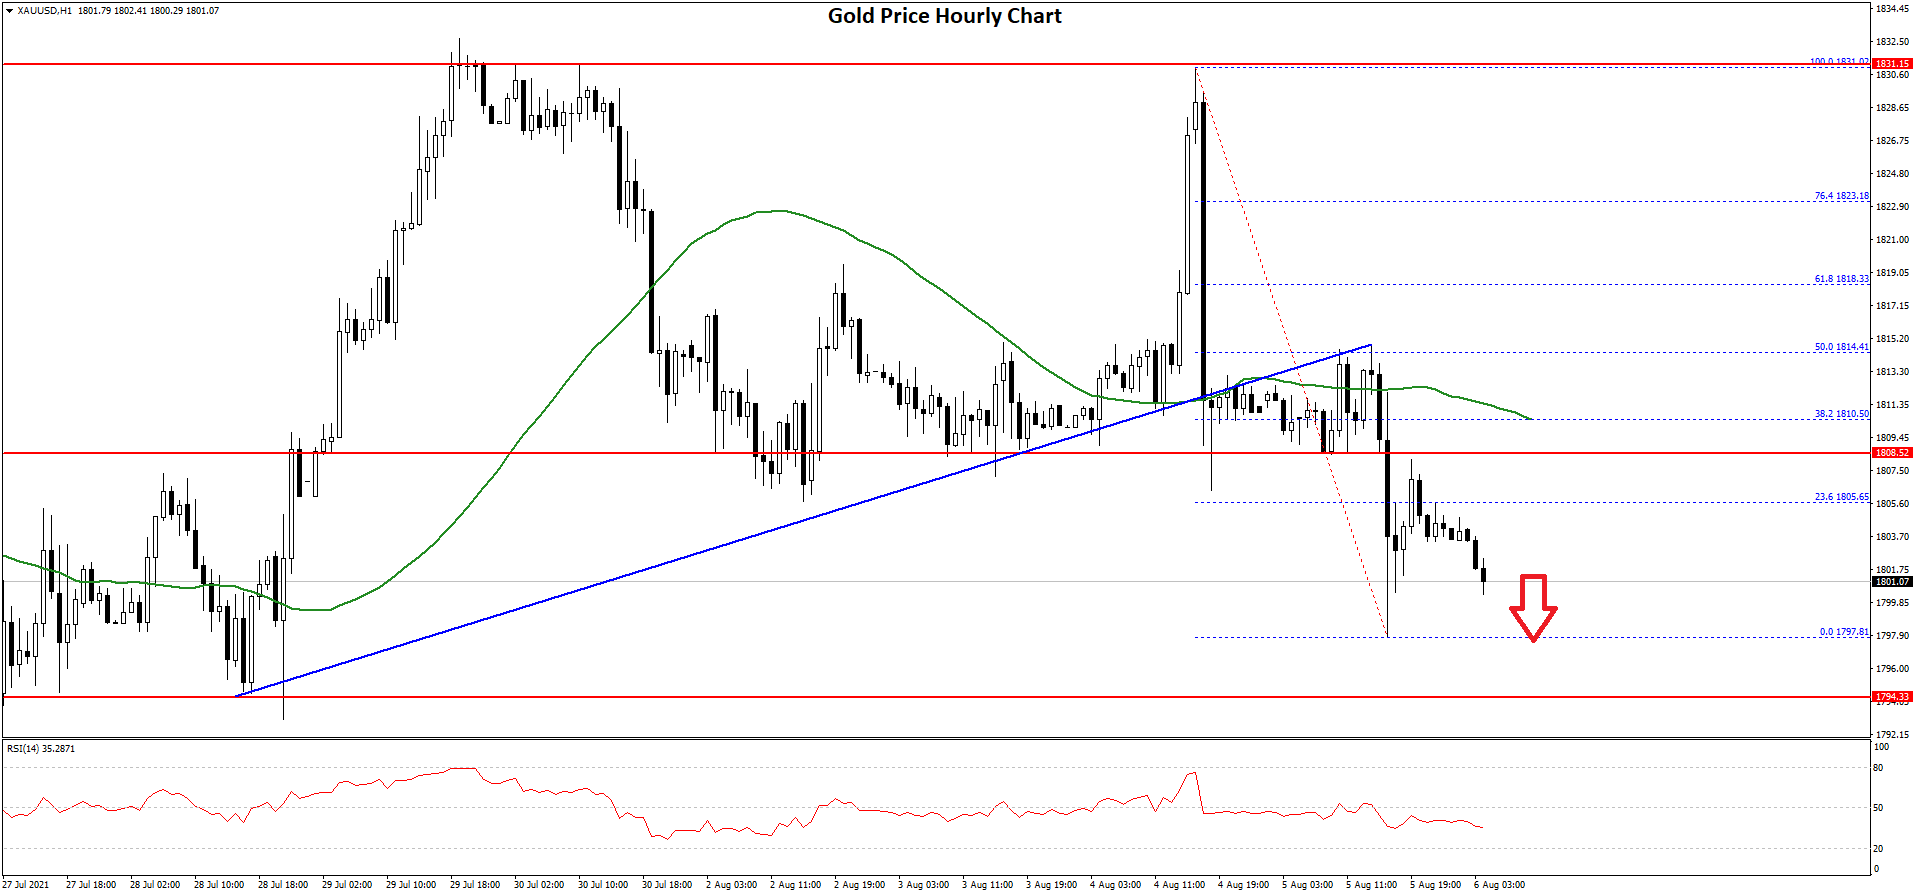
This week, gold price failed once again to clear the $1,830 resistance against the US Dollar. The price traded as high as $1,831 on FXOpen before it started a fresh decline.
There was a break below the $1,820 and $1,810 support levels. The price even broke the $1,805 support and the 50 hourly simple moving average. Besides, there was a break below a major bullish trend line with support near $1,815 on the hourly chart of gold.
The price spiked below $1,800 before the bulls appeared. The price is now consolidating losses, with an immediate resistance near the $1,810 level.
The first key resistance is near the $1,810 level and the 50 hourly simple moving average. It is near the 38.2% Fib retracement level of the downward move from the $1,831 high to $1,797 low. The main resistance is near the $1,815 level.
A close above $1,815 could set the pace for a larger increase. An initial support on the downside is near the $1,795 level. The first major support is near the $1,785 level. If there is a downside break, the price could test the $1,750 support in the near term.
Oil Price Technical Analysis
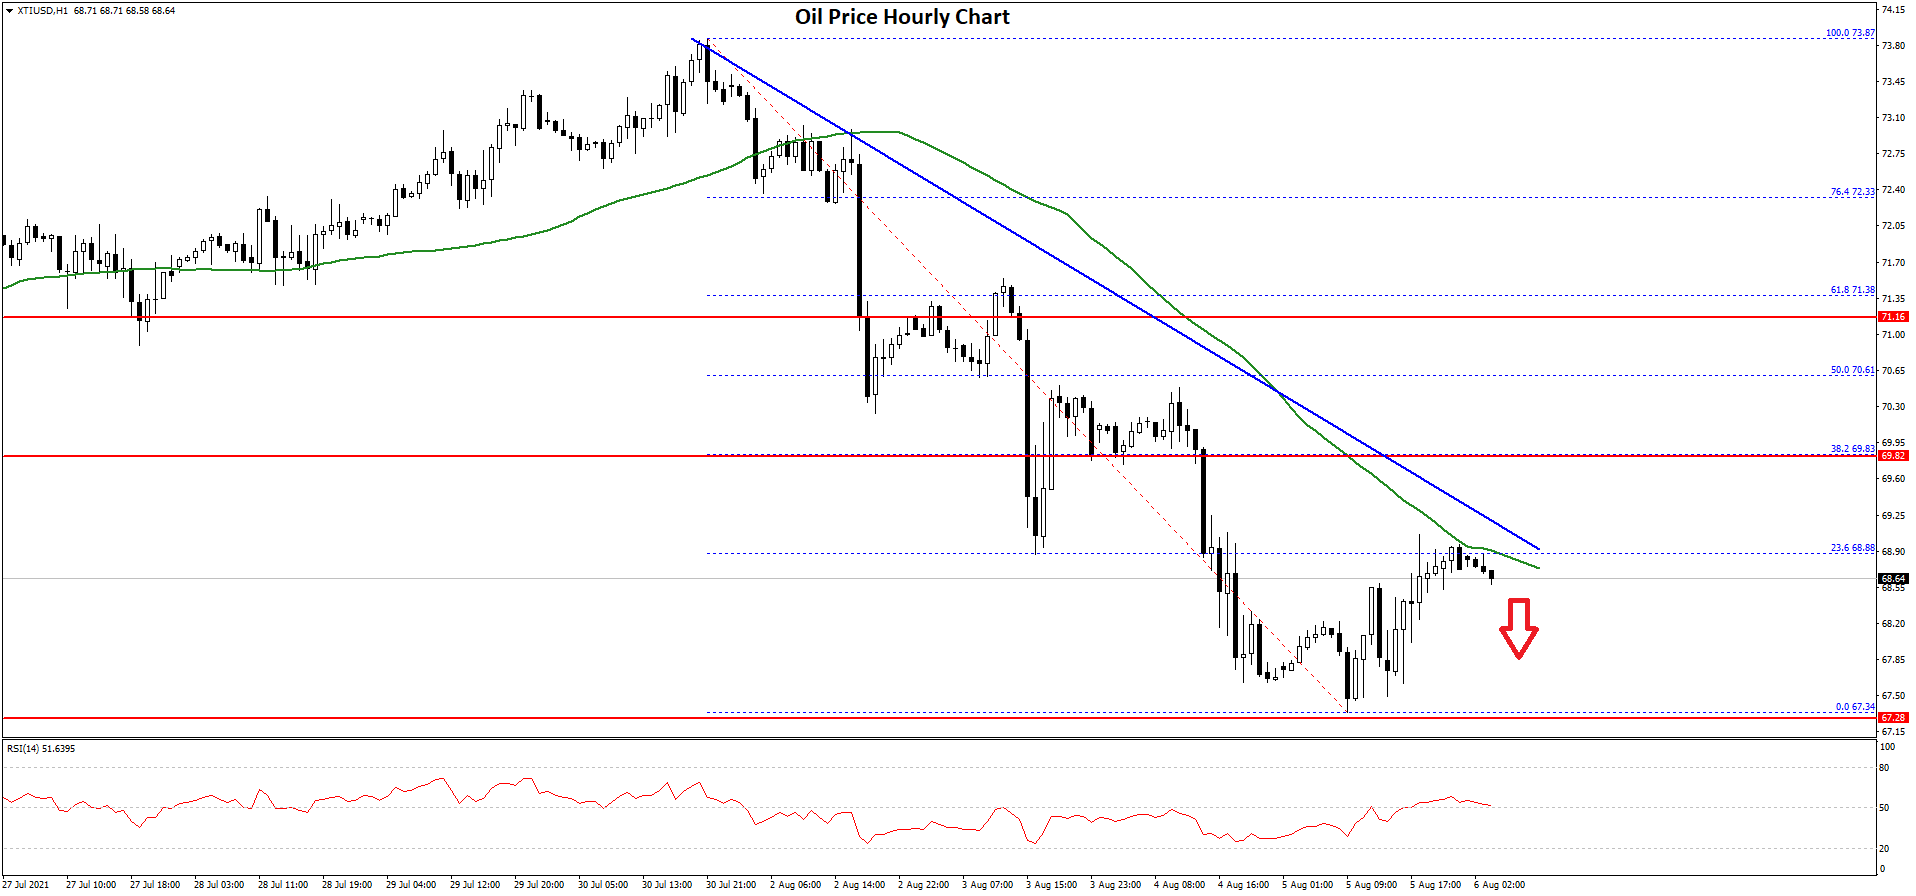
After a sharp bearish reaction from $73.80, crude oil price started a major decline against the US Dollar. The price broke the $72.00 support to move into a bearish zone.
The price even broke the $70.00 support and the 50 hourly simple moving average. It opened the doors for more losses below the $68.50 level. The price traded as low as $67.34 and it is now consolidating losses.
An immediate resistance near the $68.90 level. It is near the 23.6% Fib retracement level of the downward move from the $73.87 high to $67.34 low.
The first key resistance is near the $69.00 level and the 50 hourly simple moving average. There is also a connecting bearish trend line forming with resistance near $69.25 on the hourly chart of XTI/USD. A clear break above the trend line could lead the price towards the $70.60 level.
It is near the 50% Fib retracement level of the downward move from the $73.87 high to $67.34 low. Any more gains may possibly call for a test of the $72.00 resistance zone.
An initial support on the downside is near the $67.50 level. The first major support is near the $67.20 level. If there is a downside break, the price could extend its decline towards the $65.00 level in the coming sessions.
This forecast represents FXOpen Markets Limited opinion only, it should not be construed as an offer, invitation or recommendation in respect to FXOpen Markets Limited products and services or as financial advice.