Gold Price And Crude Oil Price Trading Near Crucial Juncture
Gold price rallied to a new multi-year high above $1,775 before correcting lower. Crude oil price is currently recovering from $37.15, but it is facing many hurdles.
Important Takeaways for Gold and Oil
- Gold price traded to a new multi-year high at $1,779 before correcting lower against the US Dollar.
- There is a major bullish trend line forming with support near $1,758 on the hourly chart of gold.
- Crude oil price started a fresh increase after trading as low as $37.15.
- There was a break above a key bearish trend line with resistance near $38.50 on the hourly chart of XTI/USD.
Gold Price Technical Analysis
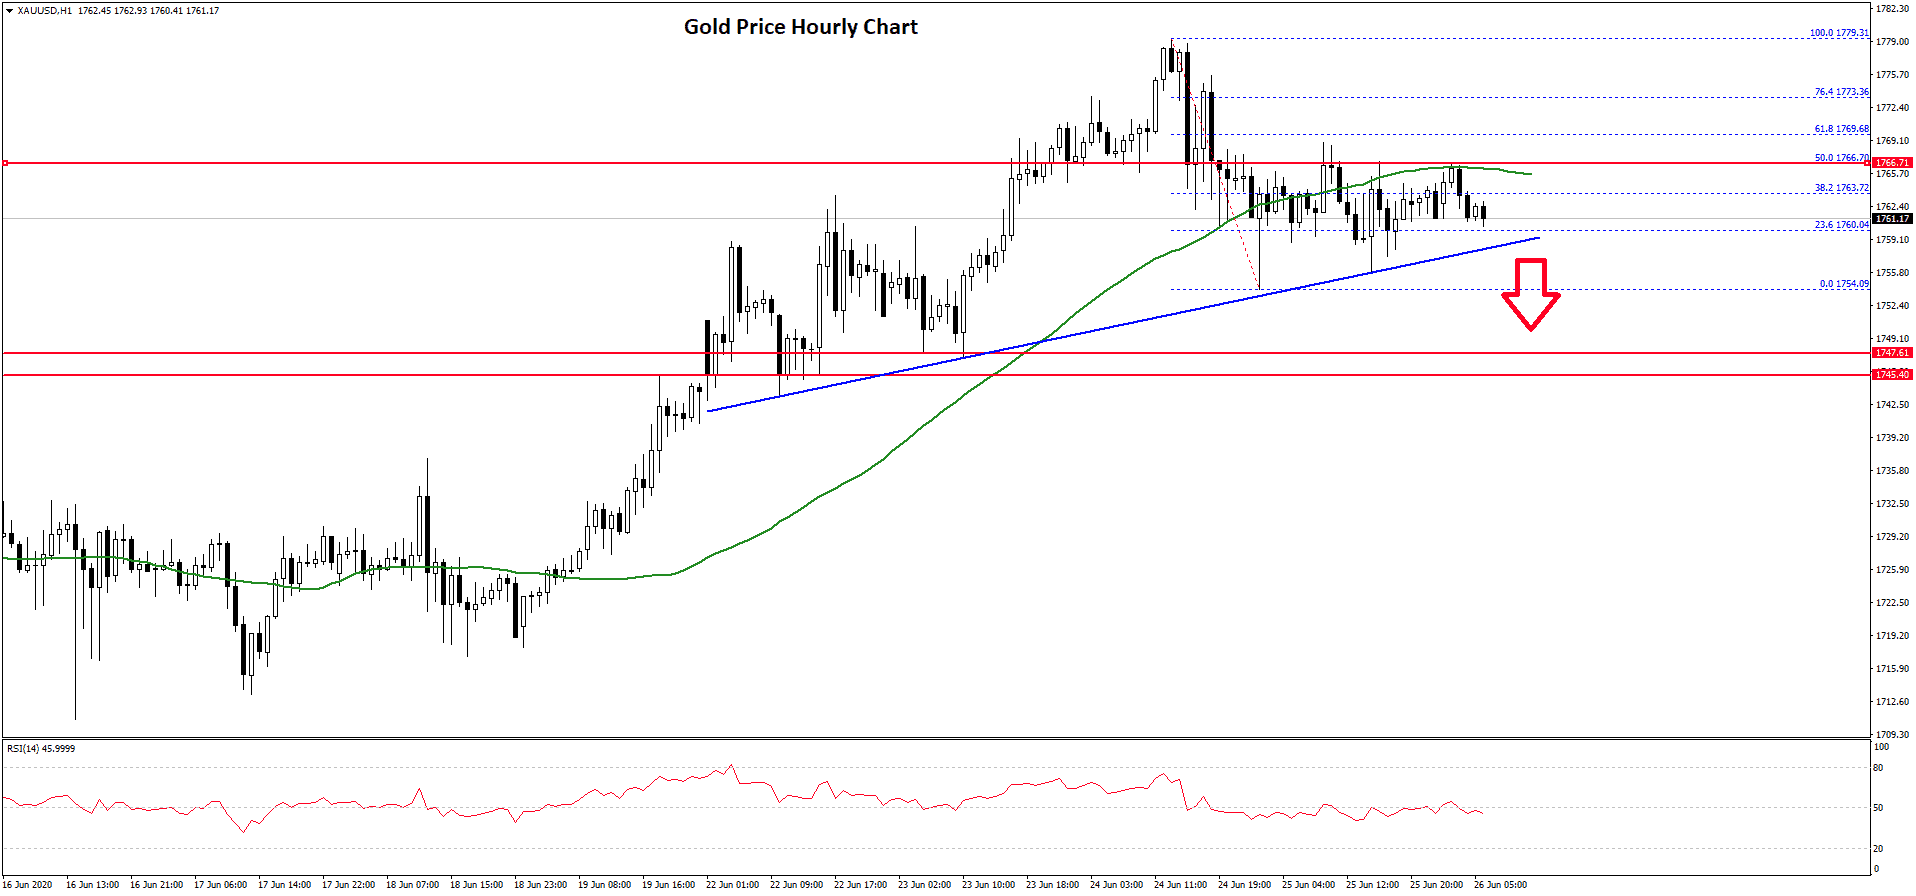
Gold price remained in an uptrend and started a fresh increase above the $1,750 resistance against the US Dollar. The price broke the $1,760 resistance level and trade to a new multi-year high.
It traded as high as $1,779 on FXOpen and recently started a downside correction. It declined below the $1,760 support level and the 50 hourly simple moving average. However, the $1,755 region acted as a support and a low is formed near $1,754.
The price is currently consolidating in a range and it managed to recover above the 23.6% Fib retracement level of the recent decline from the $1,779 high to $1,754 low.
It seems like there is a major bullish trend line forming with support near $1,758 on the hourly chart of gold. On the upside, the price is facing hurdles near the $1,766 and $1,770 levels.
The 50% Fib retracement level of the recent decline from the $1,779 high to $1,754 low is also near $1,669. Therefore, the price must break the $1,766 and $1,770 resistance levels to continue higher in the coming sessions.
The next major hurdle is at $1,780, followed by $1,788. Conversely, the price could break the trend line support at $1,758 and start a fresh decline. The main support is near the $1,748 zone, below which gold price might start a substantial drop in the coming days.
Oil Price Technical Analysis
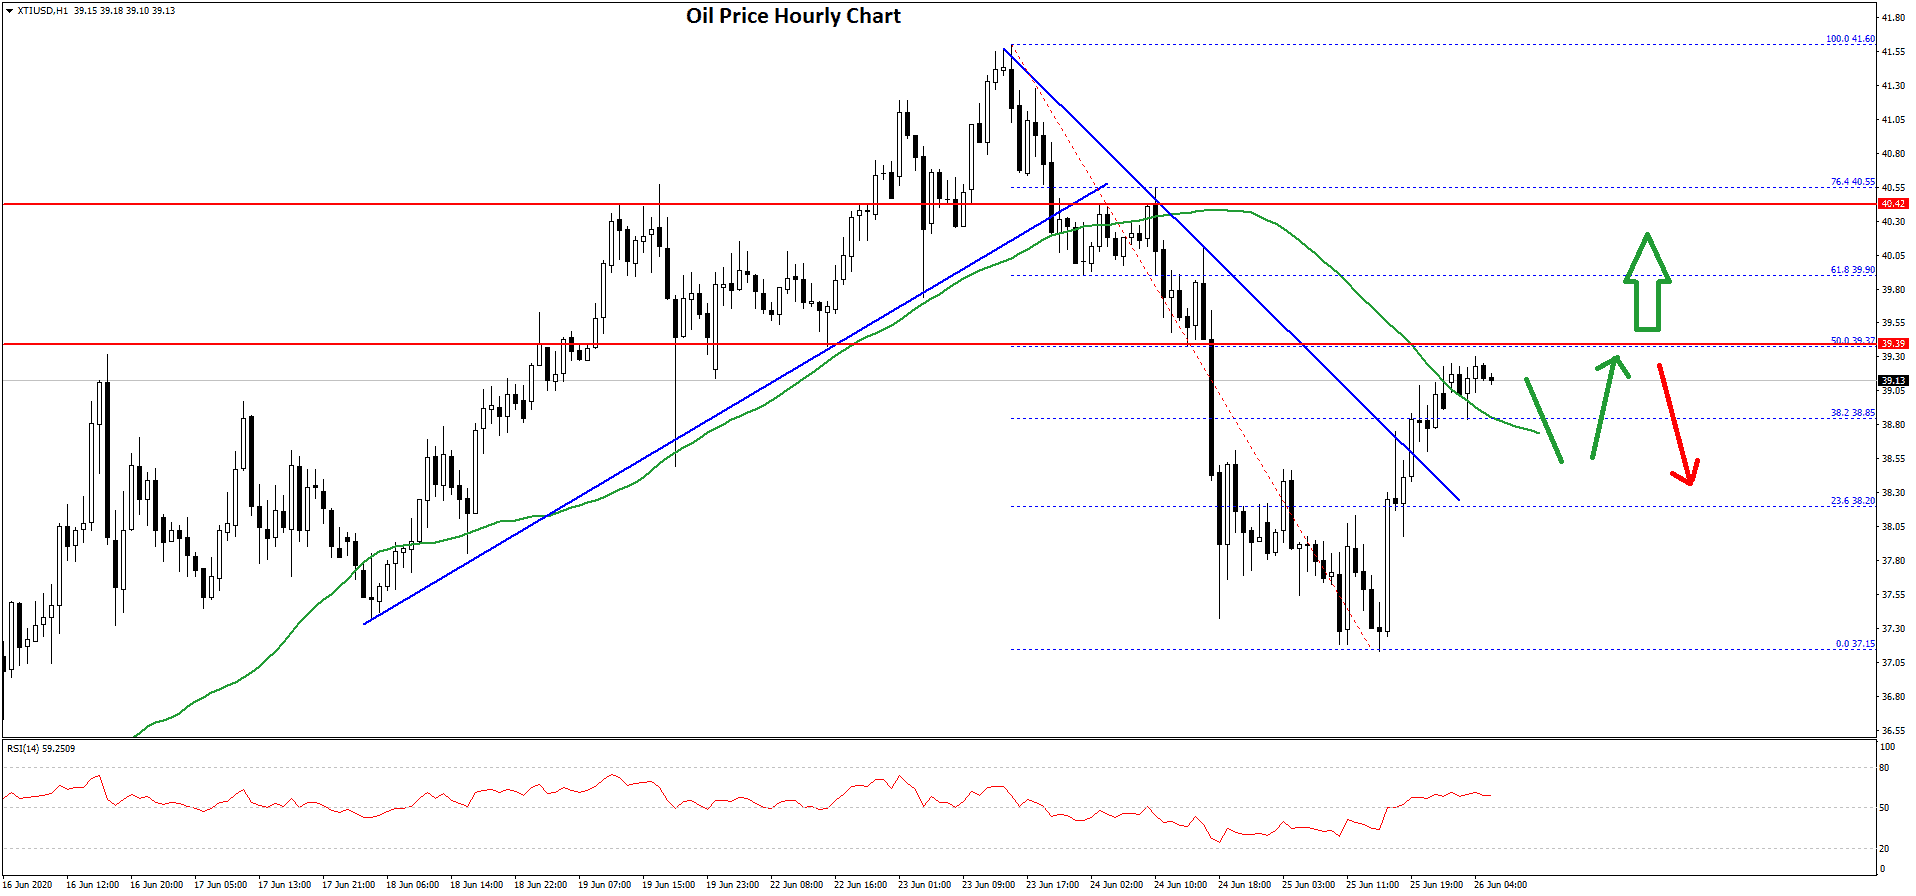
Crude oil price gained traction in the past few days and it even surged above $40.00 against the US Dollar. The price traded as high as $41.60 before starting a major downward move.
It broke the $40.00 and $39.50 support levels to move into a short term bearish zone. It traded as low as $37.15 and recently started a fresh increase. There was a break above the 23.6% Fib retracement level of the recent decline from the $41.60 high to $37.15 low.
Moreover, there was a break above a key bearish trend line with resistance near $38.50 on the hourly chart of XTI/USD. The price is now trading above the $39.00 level and the 50 hourly simple moving average.
On the upside, there is a major hurdle forming near the $39.40 level. It is close to the 50% Fib retracement level of the recent decline from the $41.60 high to $37.15 low.
Therefore, an upside break above the $39.40 and $39.50 levels is needed for a fresh increase in the coming sessions. Conversely, the price might resume its decline below the $39.00 and $38.80 levels.
The main support is near the $38.00 level, below which the price could even break the $37.15 low and trade towards the $36.50 support region.