


FXOpen
Gold price topped near the $1,290 level recently and declined below the $1,278 support area. Crude oil price also declined below the $63.00 support and it could extend losses.
Important Takeaways for Gold and Oil
- Gold price declined below the $1,280 and $1,274 support levels against the US Dollar.
- There was a break below a major bullish trend line with support at $1,282 on the hourly chart of gold.
- Crude oil price traded below a couple of important supports near the $63.00 level.
- There is a bearish trend line in place with resistance near $62.70 on the hourly chart of XTI/USD.
Gold Price Technical Analysis
Gold price faced a strong resistance near the $1,290 level against the US Dollar. As a result, the price started a downward move and broke the $1,285 and $1,280 support levels to move into a bearish zone.
There were a couple of swing moves, but the price extended losses below the $1,278 pivot level. To start the drop, there was a break below a major bullish trend line with support at $1,282 on the hourly chart of gold.
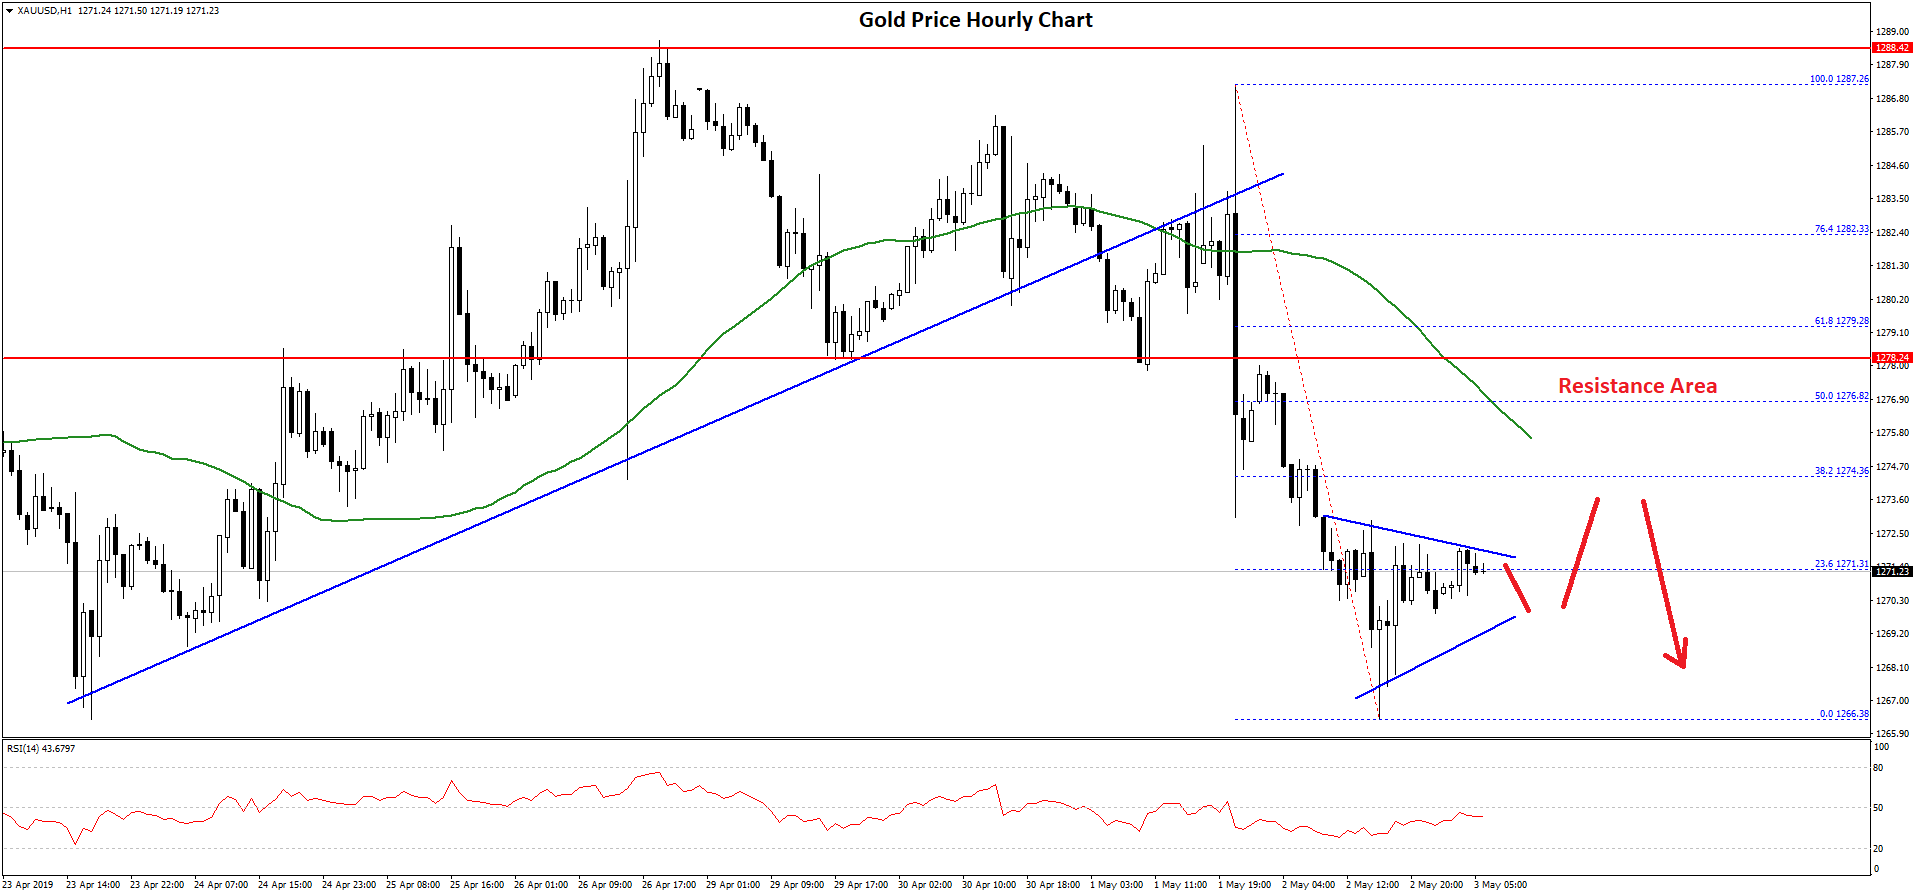
The price even broke the $1,274 support level and settled below the 50 hourly simple moving average. A swing low was formed near the $1,266 level on FXOpen and the price recently started an upside correction.
It traded above the $1,270 level and the 23.6% Fib retracement level of the latest decline from the $1,287 high to $1,266 low. However, there are many resistances on the upside near the $1,274 and $1,275 levels.
The price is likely to struggle near the $1,275 level and the 50 hourly SMA. Besides, the 50% Fib retracement level of the latest decline from the $1,287 high to $1,266 low is also near $1,276.
Therefore, to climb higher, the price must clear the $1,276 and $1,278 resistance levels. On the downside, an initial support is near the $1,270, below which the price may decline back towards the $1,265 support.
Oil Price Technical Analysis
Crude oil price started a slow and steady decline from well above the $65.00 level against the US Dollar. The price broke the $64.00 and $63.50 support levels to move into a bearish zone.
The decline was such that the price settled below the $63.00 support and the 50 hourly simple moving average. It even broke the $62.00 support and traded close to the $61.00 level.
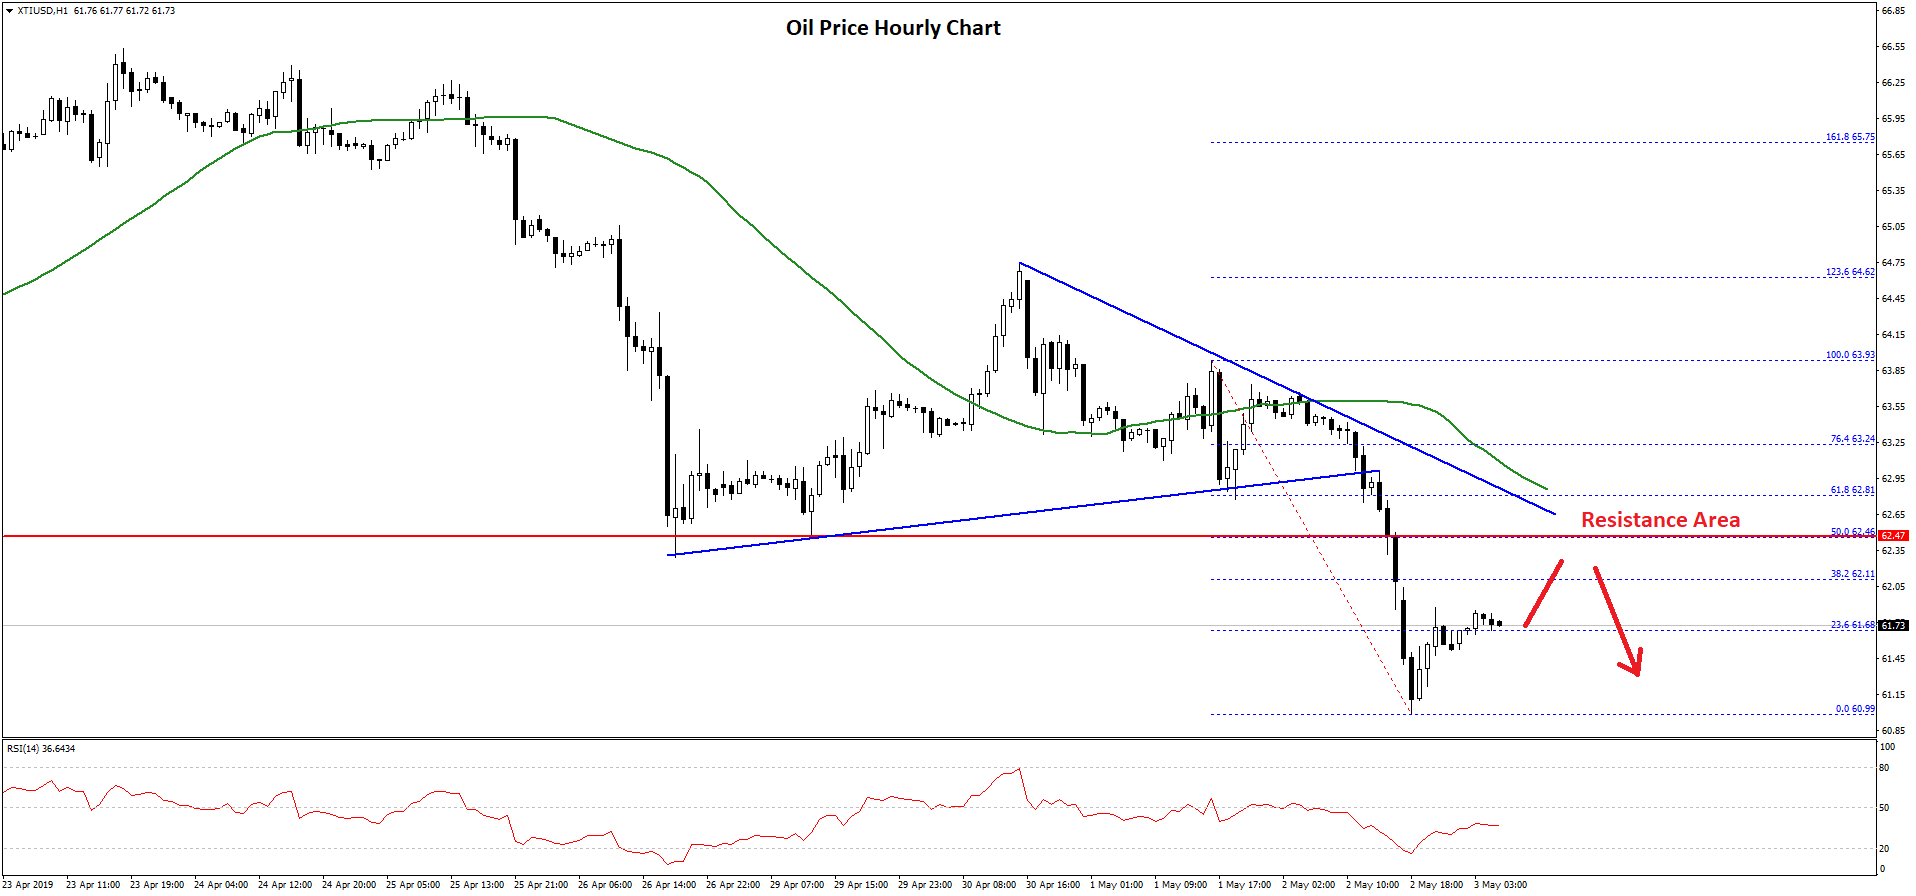
A swing low was formed at $60.99 and the price is currently correcting higher. It traded above the 23.6% Fib retracement level of the recent decline from the $63.93 high to $60.99 low.
However, there are many hurdles on the upside for the bulls near the $62.50 and $62.70 levels. There is also a bearish trend line in place with resistance near $62.70 on the hourly chart of XTI/USD. The 50% Fib retracement level of the recent decline from the $63.93 high to $60.99 low is also near $62.45 to act as a resistance.
Therefore, if the price corrects higher towards $62.50, it is likely to face a strong selling interest. On the downside, an initial support is near the $61.20 level, below which the price may even break $61.00 and trade towards $60.00.
Trade over 50 forex markets 24 hours a day with FXOpen. Take advantage of low commissions, deep liquidity, and spreads from 0.0 pips (additional fees may apply). Open your FXOpen account now or learn more about trading forex with FXOpen.
This article represents the opinion of the Companies operating under the FXOpen brand only. It is not to be construed as an offer, solicitation, or recommendation with respect to products and services provided by the Companies operating under the FXOpen brand, nor is it to be considered financial advice.
Stay ahead of the market!
Subscribe now to our mailing list and receive the latest market news and insights delivered directly to your inbox.


Latest articles

Iran Conflict and Economic Data: Events in Focus for 2-6 March
Let’s discuss three upcoming events that may impact market activity across currencies, equities, and commodities.
✔️Washington and Israel struck Iran, the supreme leader of Iran Ayatollah Khamenei was killed. Iran retaliated, escalating tensions.
Oil jumped over 8%, global stocks

WTI Oil Trading Opens with a 10% Bullish Gap
On Friday, we warned that trading on Monday could be volatile — but not to this extent! The situation sharply escalated over the weekend following a large-scale strike by Israel and the US on targets in Iran, during which the supreme

Geopolitical Shock: Gold Price Storms $5,400 After Attack on Iran
The reason is clear: confirmed US and Israeli strikes on targets in Iran, including reports of the death of Supreme Leader Ali Khamenei, have triggered renewed demand for safe-haven assets, pushing gold prices higher.
As of Monday morning, news of