Gold Price and Oil Price Eye Additional Gains
Gold price started a fresh increase after testing the $1,680 support zone. Crude oil price is trading nicely above $60.00 and it might continue to rise steadily.
Important Takeaways for Gold and Oil
- Gold price remained well bid near the $1,680 and $1,675 levels against the US Dollar.
- There was a break above a major bearish trend line with resistance near $1,708 on the hourly chart of gold.
- Crude oil price is holding the key $59.50 and $60.00 support levels.
- There was a break above a key bearish trend line with resistance near $60.55 on the hourly chart of XTI/USD.
Gold Price Technical Analysis
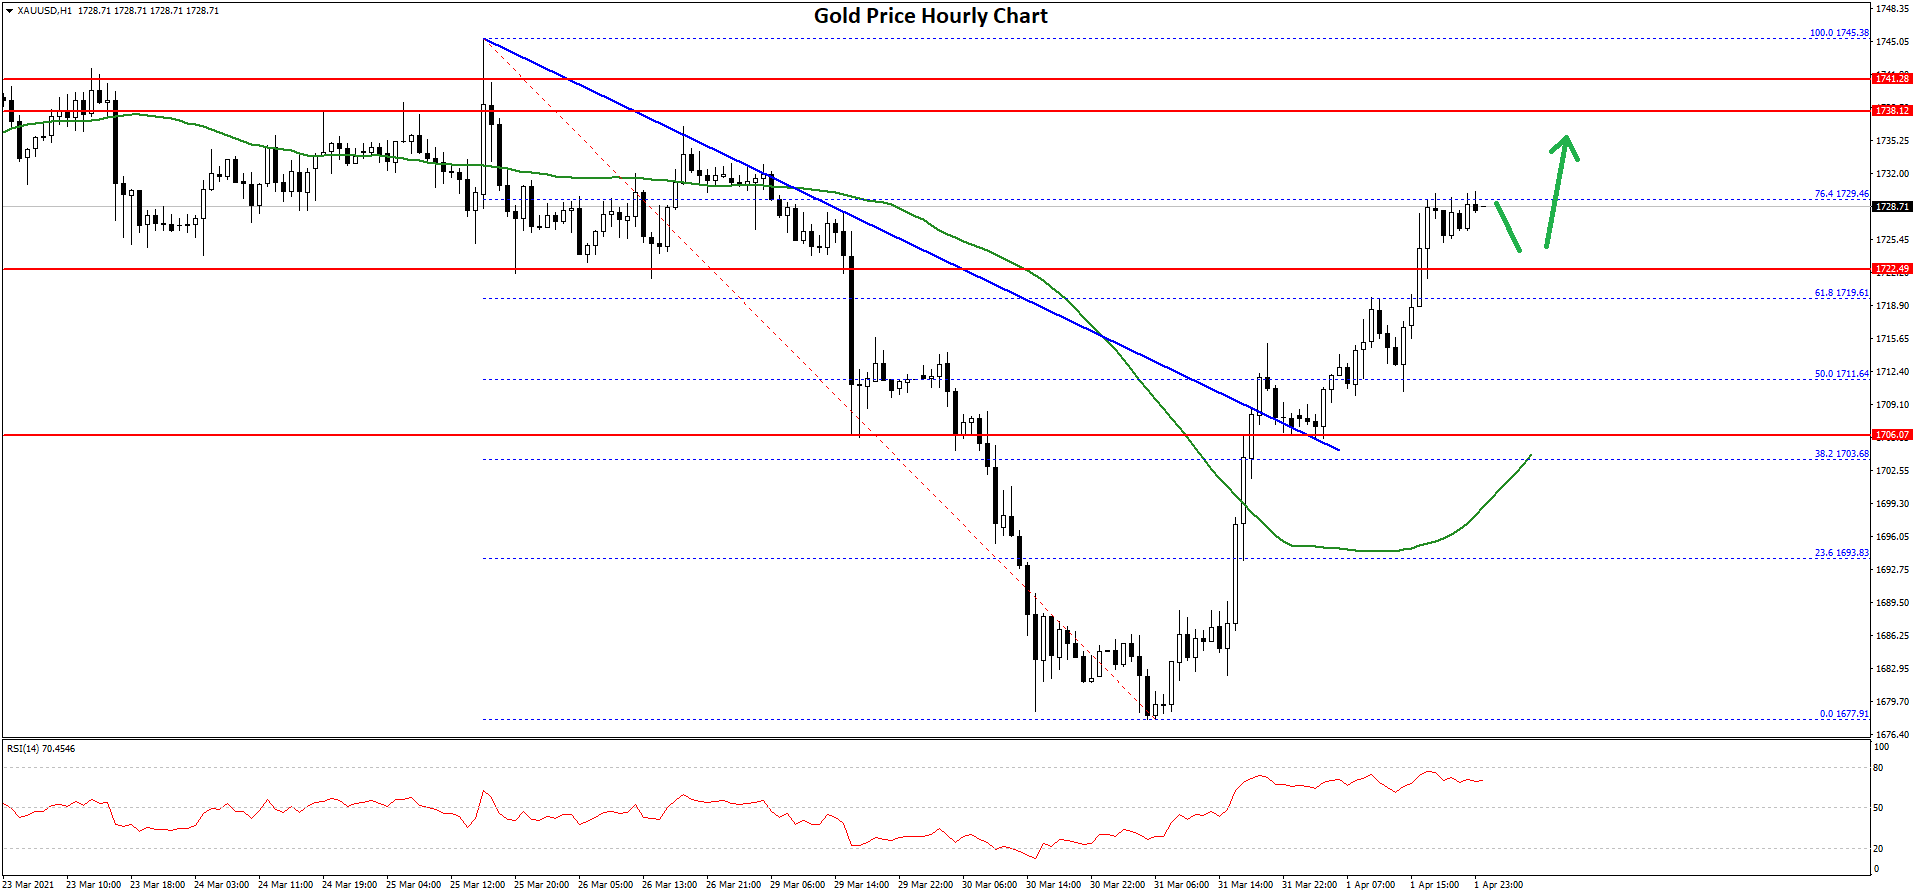
Earlier this week, gold price extended its decline below the $1,710 and $1,700 support levels against the US Dollar. However, the bulls were active near the $1,680 and $1,675 levels.
A low was formed near $1,677 on FXOpen before the price started a fresh increase. There was a break above the $1,695 and $1,700 resistance levels. The price climbed nicely above the 50% Fib retracement level of the downward move from the $1,745 swing high to $1,677 low.
There was also a break above a major bearish trend line with resistance near $1,708 on the hourly chart of gold. The price is now trading well above $1,710 and the 50 hourly simple moving average.
It is now testing the 76.4% Fib retracement level of the downward move from the $1,745 swing high to $1,677 low. A successful break above the $1,730 resistance could open the doors for a larger increase in the coming sessions.
The next key resistance is near the $1,745 level. The main resistance is still near $1,750, above which the price could test $1,780. Conversely, the price could fail to continue higher and it might decline below the $1,720 level.
The main support is near the $1,705 level. A clear break below the $1,705 support may possibly start a strong decline towards $1,675 in the near term.
Oil Price Technical Analysis
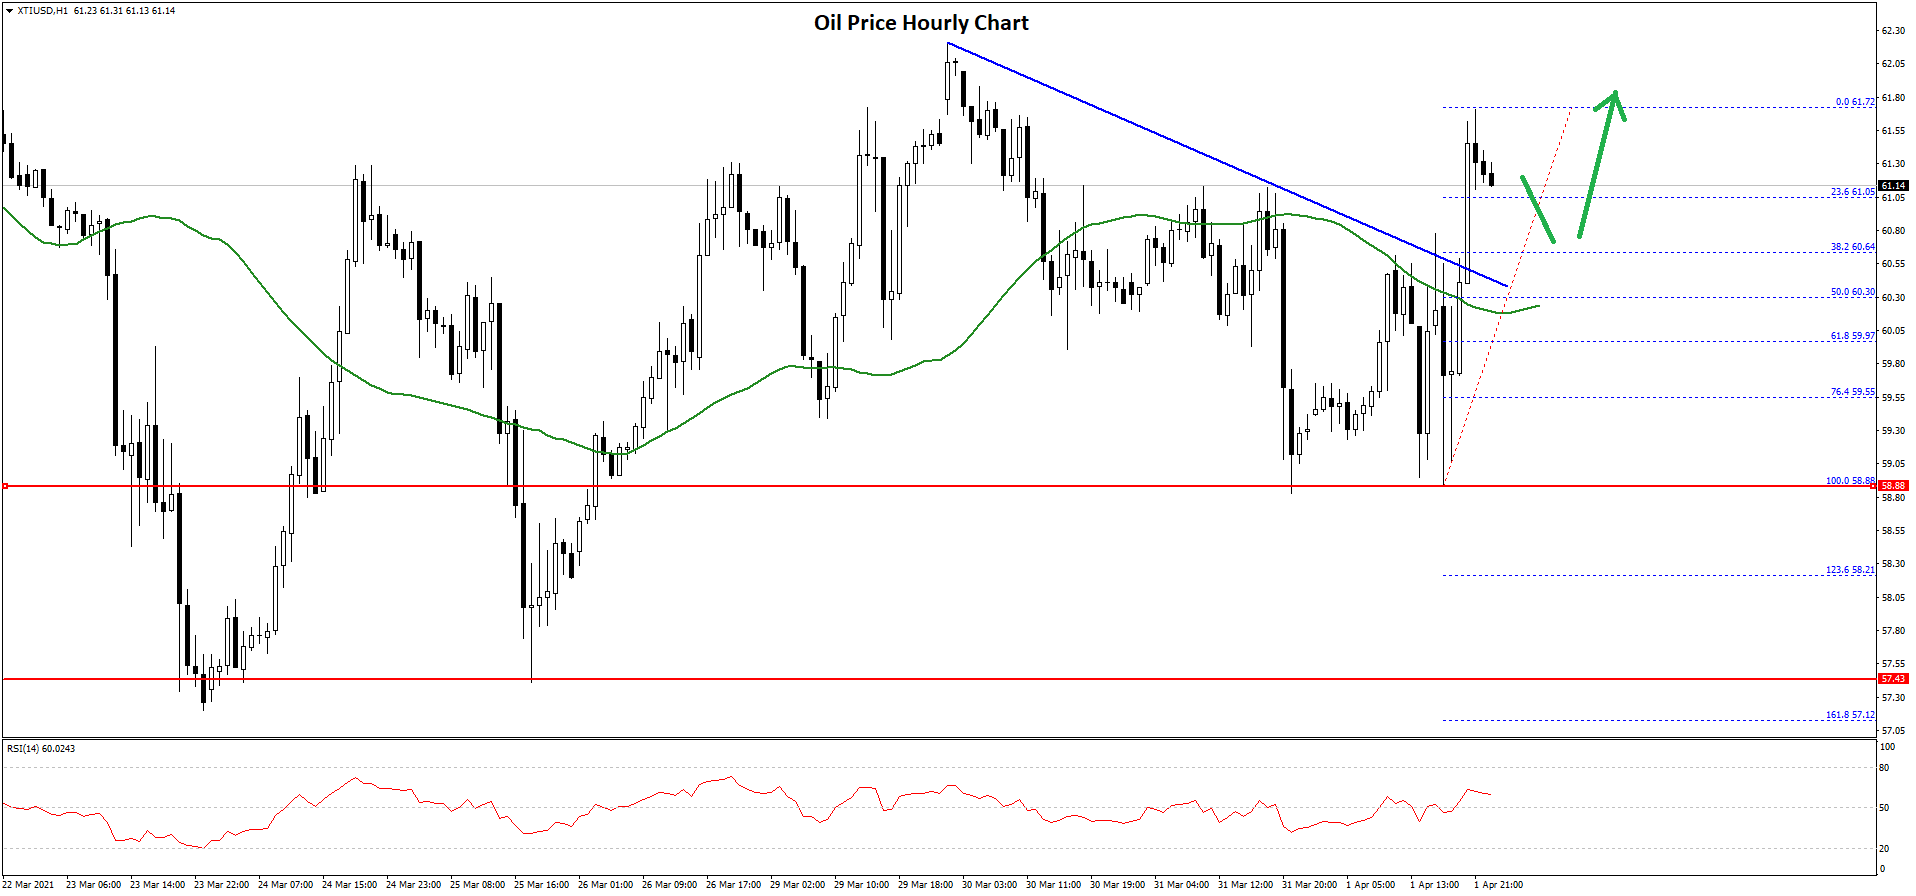
Crude oil price remained well bid above the $57.50 support level against the US Dollar. The price gained pace and recently settled nicely above the $59.00 level.
The recent swing low was formed near $58.88 before there was a fresh increase. The price cleared the main $60.00 resistance zone and the 50 hourly simple moving average. There was also a break above a key bearish trend line with resistance near $60.55 on the hourly chart of XTI/USD.
The price traded as high as $61.72 and it is currently correcting lower. An initial support is near the 23.6% Fib retracement level of the recent wave from the $58.88 low to $61.72 high at $61.05.
The first major support is near the broken trend line at $60.30 and the 50 hourly simple moving average. It is close to the 50% Fib retracement level of the recent wave from the $58.88 low to $61.72 high.
Any more losses might call for a test of the $60.00 support zone. Conversely, the price might resume its rise above the $61.75 and $62.00 levels. If there is an upside break above $62.00, the price could rally towards the $62.80 and $63.00 levels. The next major resistance is near the $63.45 level.