Gold Price Approaching Resistance While Crude Oil Price Correcting Gains
Gold price is rising steadily and it is trading above the $1,600 resistance. Conversely, crude oil price rallied towards $28.00 and recently corrected more than 40% gains.
Important Takeaways for Gold and Oil
- Gold price formed a strong support above $1,570 and recovered higher against the US Dollar.
- There is a major contracting triangle forming with resistance near $1,615 on the hourly chart of gold.
- Crude oil price rallied towards the $28.00 and $28.50 resistances before correcting lower.
- There was a break above a key bearish trend line with resistance near $22.85 on the hourly chart of XTI/USD.
Gold Price Technical Analysis
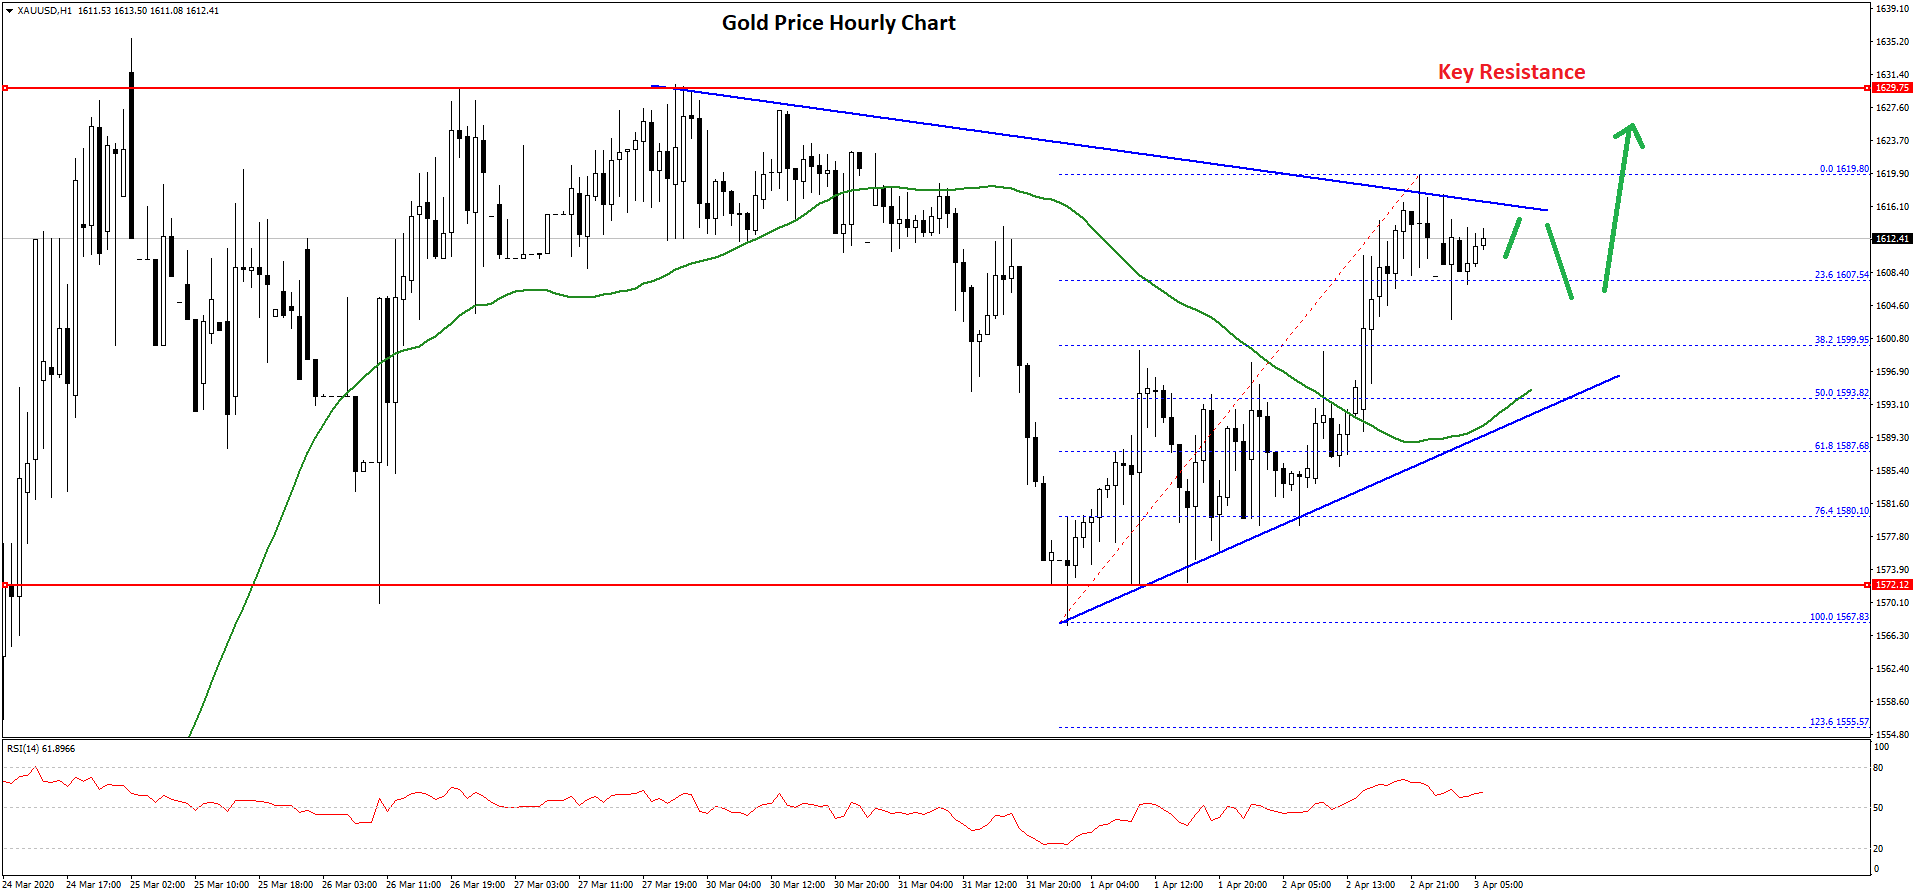
Earlier this week, gold price declined from well above the $1,600 level against the US Dollar. It traded below the $1,580 support area, but the $1,570 zone acted as a strong support.
A swing low is formed near $1,567 on FXOpen and the price formed a decent base above the $1,570 level. As a result, the price started a fresh increase above the $1,580 and $1,600 resistance levels.
The bulls remained in action and the price even climbed above the $1,610 level and the 50 hourly simple moving average. Finally, the price climbed towards $1,620 and traded as high as $1,619.
It is currently consolidating gains below $1,620. An initial support is near the 23.6% Fib retracement level of the recent wave from the $1,567 low to $1,619 high.
The first major support is near the $1,600 level, followed by $1,595. The 50% Fib retracement level of the recent wave from the $1,567 low to $1,619 high is also near the $1,595 level along with the 50 hourly simple moving average.
Any further losses may perhaps push the price back into a bearish zone towards the $1,570 support. At the outset, there is a major contracting triangle forming with resistance near $1,615 on the hourly chart of gold.
If there is an upside break above the triangle resistance, the price could test the main $1,630 resistance area. Any further gains could lead the price towards the $1,645 level in the near term.
Oil Price Technical Analysis
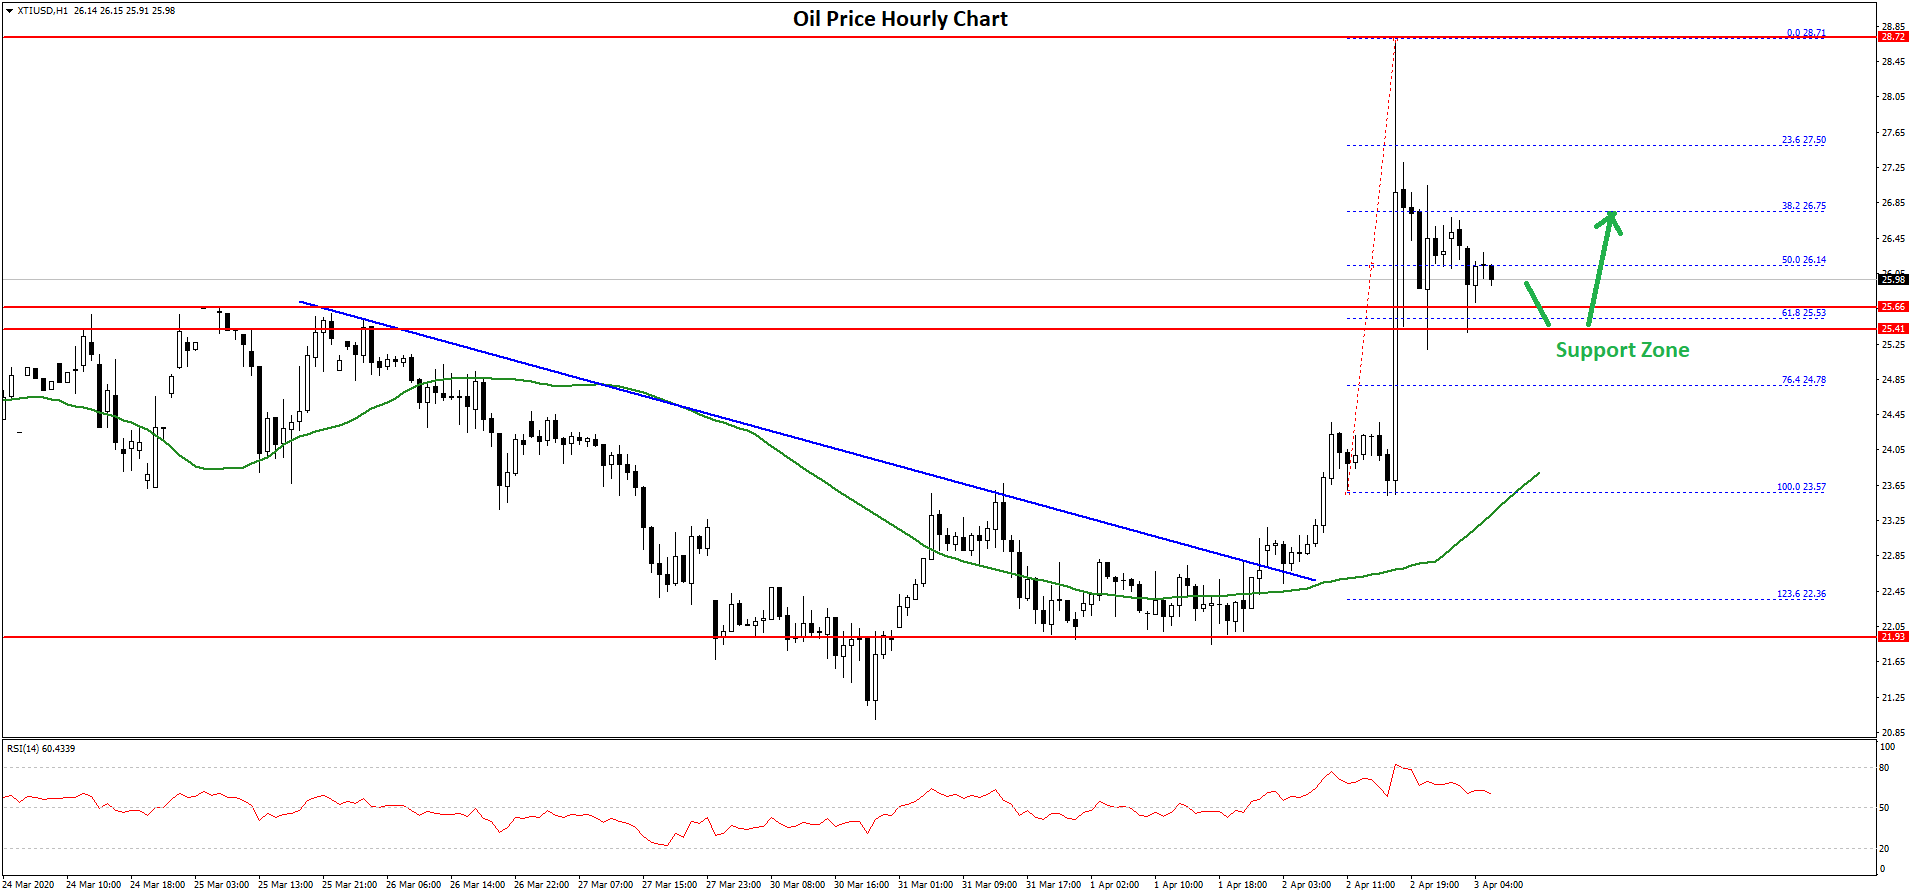
Recently, crude oil price formed a strong support base above the $22.00 level against the US Dollar. The price started a nasty upward move and broke many hurdles near the $25.00 resistance.
It even climbed above the $26.50 level and settled well above the 50 hourly simple moving average. More importantly, there was a break above a key bearish trend line with resistance near $22.85 on the hourly chart of XTI/USD.
Finally, the price surged towards the $28.00 and $28.50 resistance levels. It traded as high as $28.71 and recently corrected lower. There was a break below the $27.50 and $26.80 levels.
Besides, the price spiked below the 50% Fib retracement level of the recent surge from the $23.57 low to $28.71 high. On the downside, the $25.50 area is acting as a strong support (the previous breakout zone).
The 61.8% Fib retracement level of the recent surge from the $23.57 low to $28.71 high is also near the $25.50 level. If the price fails to stay above the $25.50 support, it could decline back towards the $24.00 level and the 50 hourly SMA.
Conversely, the price could resume its upward move and climb higher towards the $28.00 resistance area in the near term.