Gold Price Broke Key Support While Oil Price Continues to Rise
Gold price faced a strong resistance near $1,235 and declined sharply. However, Crude oil price remains in an uptrend and it looks set for more gains above $70.00.
Important Takeaways for Gold and Oil
- Gold price likely formed a double top pattern near the $1,265 level against the US Dollar.
- There was a break below a key bullish trend line with support at $1,226 on the hourly chart of gold.
- Crude oil price is following a crucial ascending channel with support at $68.80 on the hourly chart.
- The US Durable Goods Orders in June 2018 increased 1%, less than the forecast of +3.0%.
Gold Price Technical Analysis
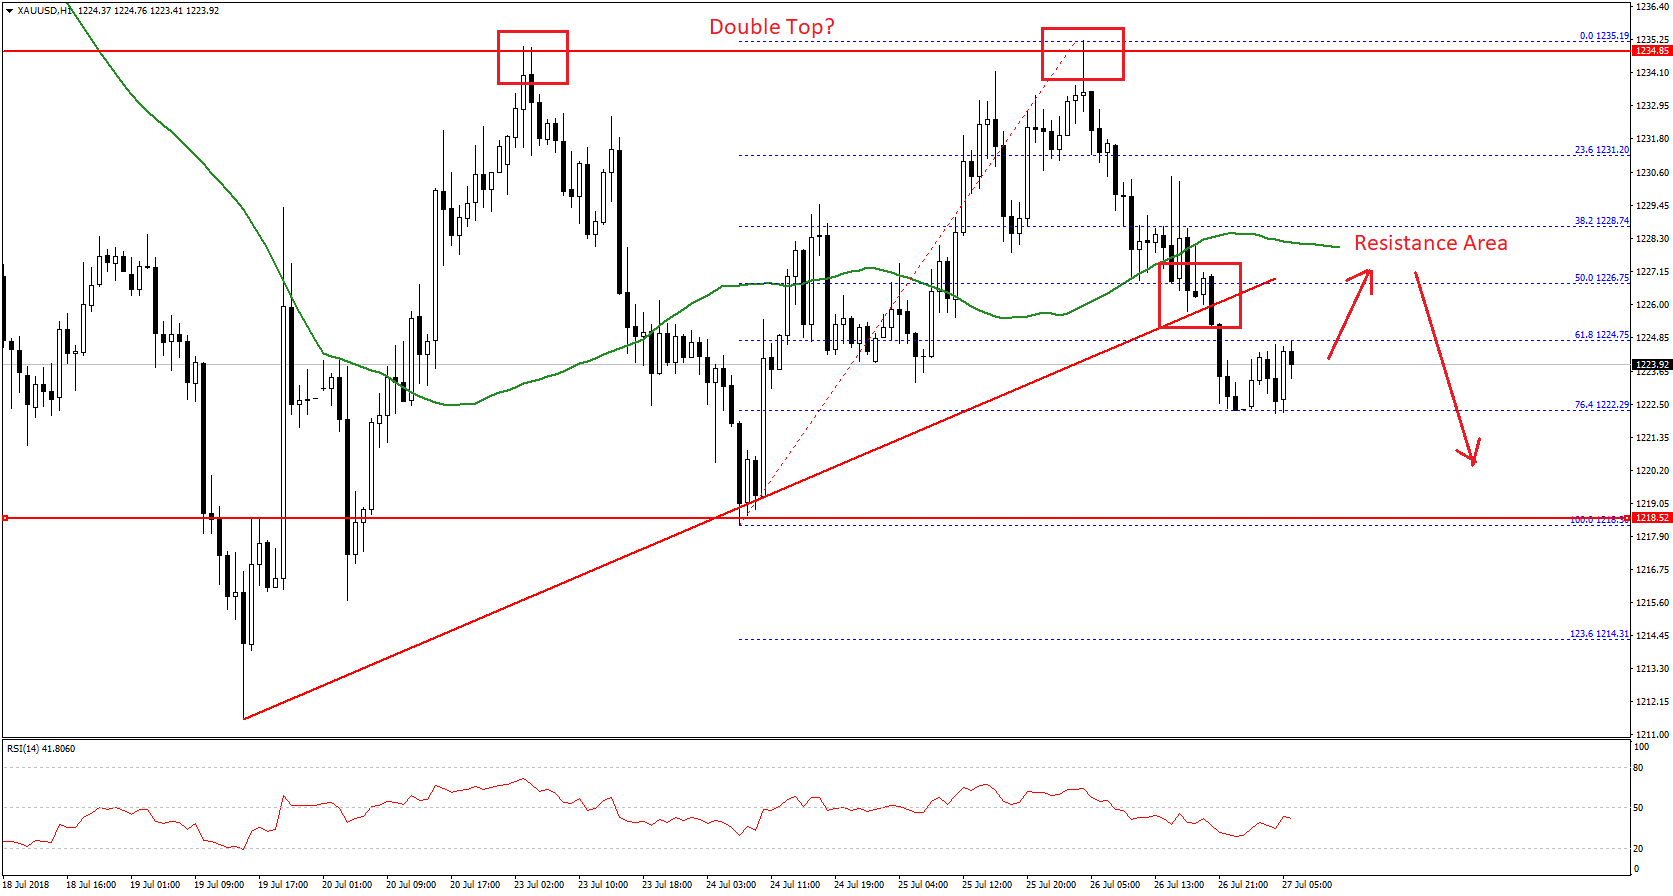
Gold price climbed higher this week above the $1,230 level against the US Dollar. However, the price faced a major resistance near the $1,235 level, which prevented further upsides.
There were two rejections noted around the $1,235 resistance, resulting in a downside move. There was a sharp decline and the price broke the $1,228 support. Moreover, there was a break below a key bullish trend line with support at $1,226 on the hourly chart.
The price even broke the 50% Fib retracement level of the last wave from the $1,218 low to $1,235 high. It seems like the price formed a double top pattern near the $1,265 level. At present, it is holding the 76.4% Fib retracement level of the last wave from the $1,218 low to $1,235 high at $1,222.
Should there be a downside break below $1,222, the price may perhaps decline further towards the $1,218 low. Below this, there are chances of acceleration towards the $1,210 level in the near term.
On the other hand, if the price corrects higher, the previous support near $1,228 and the 50 hourly simple moving average are likely to act as resistances. Above this, the double top resistance near $1,235 could once again prevent gains.
Oil Price Technical Analysis
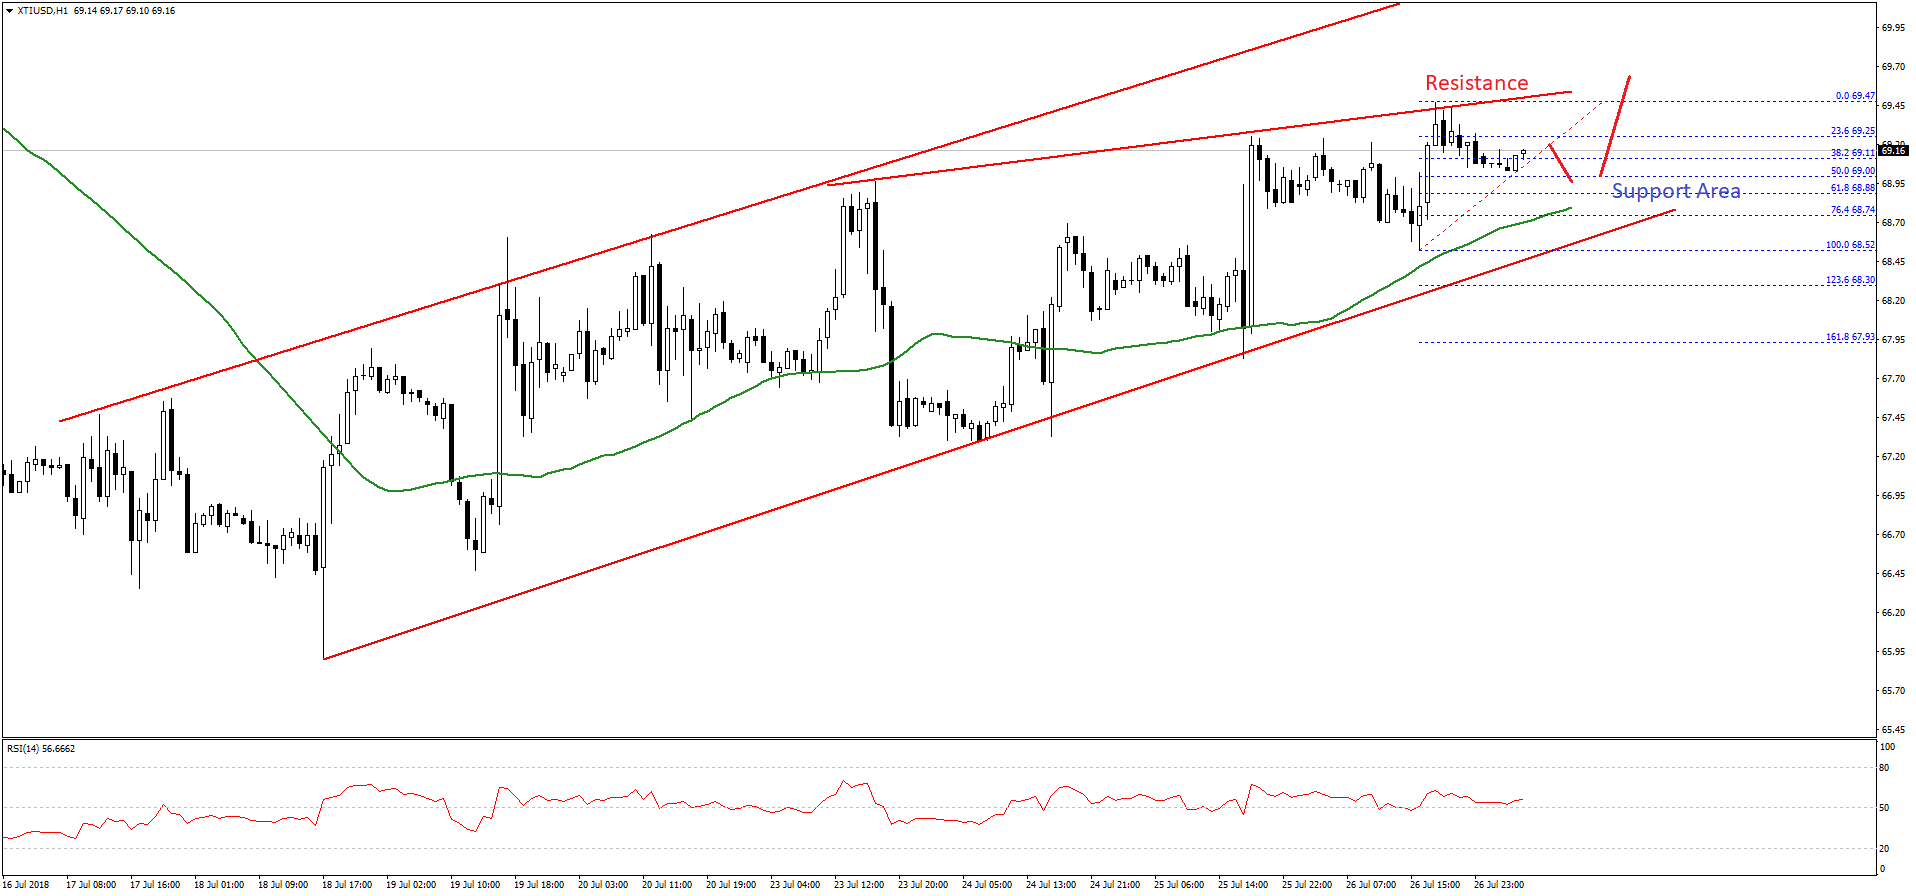
Crude oil price started a major uptrend from the $66.00 support zone against the US Dollar. The price traded higher and broke the $66.50, $67.00 and $68.00 resistance levels.
The price is accelerating higher and is currently trading well above the $68.50 level and the 50 hourly simple moving average. More importantly, there is a crucial ascending channel formed with support at $68.80 on the hourly chart.
The price recently traded as high as $69.47 where it faced a connecting resistance trend line. It corrected lower and tested the 50% Fib retracement level of the last wave from the $68.52 low to $69.47 high.
On the downside, there are many supports around the $68.80 level. The 50 hourly SMA is positioned near the channel support at $68.80 to act as a strong buy zone. Therefore, if the price dips towards $68.80, it is likely to find buyers.
Should there be a break below $68.80, the price may perhaps decline further towards $68.00. To the topside, a break above the trend line resistance at $69.50 could open the doors for a push above the $70.00 level in the near term.
Recently in the US, the Durable Goods Orders report for June 2018 was released. The market was looking for a rise of 3% in the Durable Goods Orders, but the actual result was disappointing as there was a 1% rise in orders.