Gold Price Correcting Gains While Crude Oil Price Approaching Breakout
Gold price rallied recently to a new 8-year high above $1,740 and it is currently correcting lower. Conversely, crude oil price is now showing signs of a bullish breakout above $27.00.
Important Takeaways for Gold and Oil
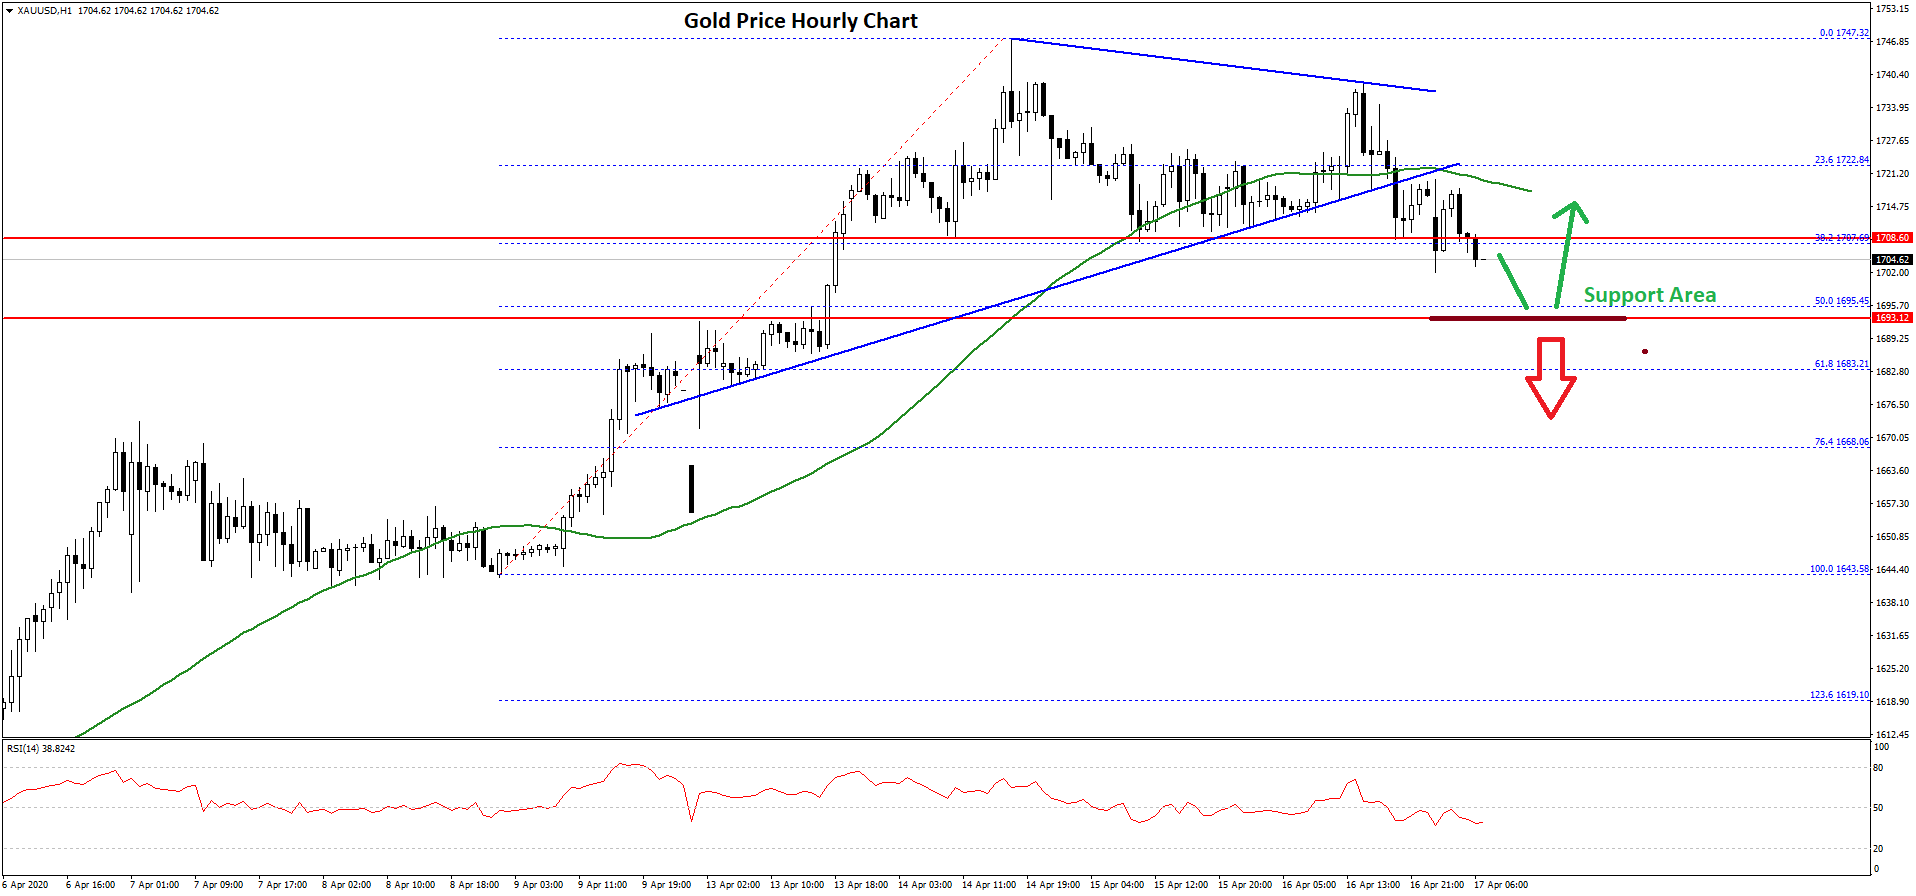
- Gold price surged towards the $1,750 level and it is currently correcting against the US Dollar.
- There was a break below a key contracting triangle with support near $1,720 on the hourly chart of gold.
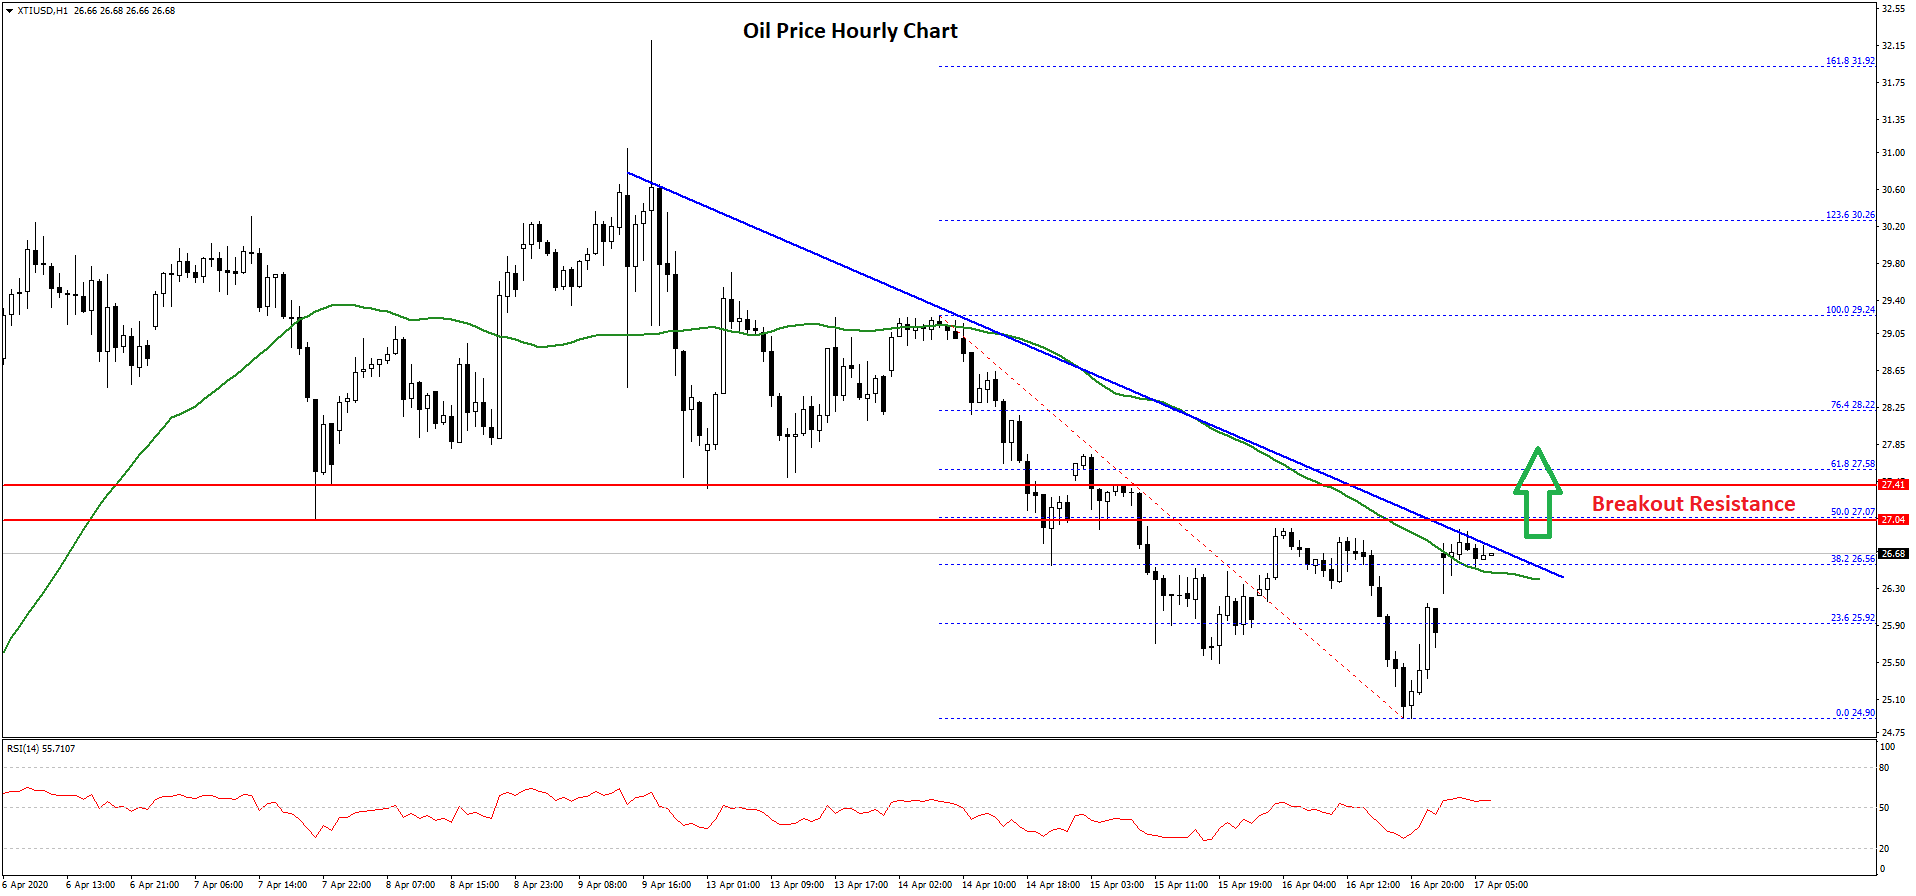
- Crude oil price is currently showing a few recovery signs above the $25.00 support.
- There is a major bearish trend line forming with resistance near $26.85 on the hourly chart of XTI/USD.
Gold Price Technical Analysis
Earlier this week, gold price extended its rise above the $1,700 resistance area against the US Dollar. It even broke the $1,720 resistance area to continue higher.
Finally, the price traded close to the $1,750 resistance and formed a new 8-year high at $1,747 on FXOpen. The price is currently correcting lower and trading below the $1,725 support level and the 50 hourly simple moving average.
There was a break below the 38.2% Fib retracement level of the recent rally from the $1,643 low to $1,747 high. Moreover, there was a break below a key contracting triangle with support near $1,720 on the hourly chart of gold.
The price is now trading below the $1,710 level, with an immediate support near the $1,700 level. The first key support is near the $1,695 level since it is close to the 50% Fib retracement level of the recent rally from the $1,643 low to $1,747 high.
Any further losses may perhaps push the price back towards the $1,680 support level in the near term. On the upside, the previous support near the $1,720 level and the 50 hourly simple moving average could act as a hurdle.
To start a fresh increase, the price must gain bullish momentum above the $1,720 and $1,725 resistance levels. The main resistance on the upside is still near $1,750.
Oil Price Technical Analysis
Crude oil price remained in a bearish zone and traded below the $27.00 support against the US Dollar. The price even broke the $25.00 support and traded as low as $24.90.
It is currently correcting above the $25.00 and $25.50 levels. There was a break above the 23.6% Fib retracement level of the recent decline from the $29.24 high to $24.90 low.
The price is now trading above the $26.00 level and the 50 hourly simple moving average. However, there is a key resistance forming near the $26.80 and $27.00 levels.
There is also a major bearish trend line forming with resistance near $26.85 on the hourly chart of XTI/USD. The 50% Fib retracement level of the recent decline from the $29.24 high to $24.90 low might also act as a hurdle near $27.07.
Therefore, oil price must surpass the $27.00 and $27.40 resistance levels to continue higher in the near term. The next major hurdle on the upside sits near the $28.20 and $28.50 levels.
Conversely, the price could resume its decline below the $26.00 level in the near term. ON the downside, the main support is near the $25.00 level, below which it could slide towards the $23.20 support area.