Gold Price Could Bounce Back While Crude Oil Price Is Facing Hurdle
Gold price climbed higher sharply from the $1,400 support area and is currently correcting lower. Conversely, crude oil price is under pressure and is facing hurdles.
Important Takeaways for Gold and Oil
- Gold price climbed higher sharply from the $1,400 support area to $1,445 against the US Dollar.
- There was a break above a short term declining channel with resistance near $1,408 on the hourly chart of gold.
- Crude oil price started a major decline and broke the key $55.75 support area.
- There is a crucial bearish trend line forming with resistance near $56.20 on the hourly chart of XTI/USD.
Gold Price Technical Analysis
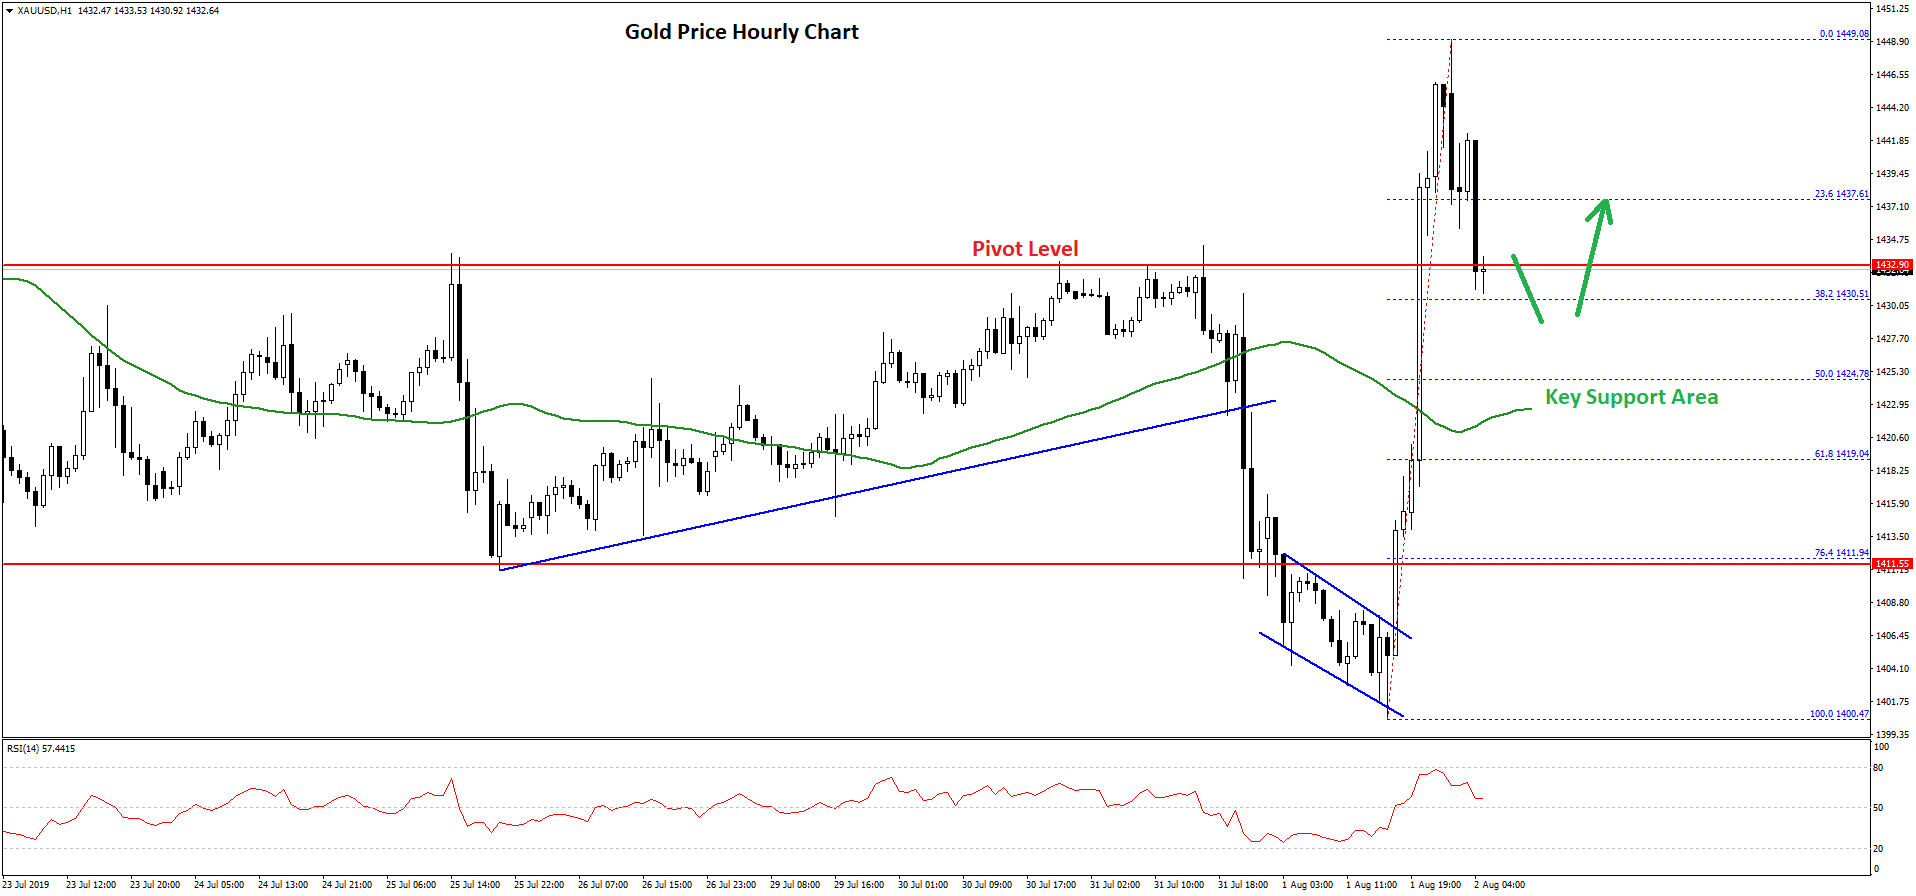
Earlier this week, gold price declined below the $1,420 support against the US Dollar. The price even broke the $1,412 support level and tested the $1,400 support, where the bulls took a stand.
A swing low was formed near $1,400 on FXOpen and the price started a solid upward move. It broke many resistances near the $1,410 level. Moreover, there was a break above a short term declining channel with resistance near $1,408 on the hourly chart of gold.
The price rallied above the $1,430 resistance and the 50 hourly simple moving average. A swing high was formed near $1,449 and the price is currently correcting lower.
It broke the $1,440 level plus the 23.6% Fib retracement level of the upward move from the $1,400 low to $1,449 high. The price is now trading near the key $1,430-$1,432 support level.
If there are more downside, the price could test the next important support at $1,425. The 50% Fib retracement level of the upward move from the $1,400 low to $1,449 high is also near the $1,424 level.
On the upside, an initial resistance is near the $1,438 level. If the price starts a fresh increase above the $1,438 and $1,440 resistance levels, there are high chances of more gains above the $1,445 level.
Oil Price Technical Analysis
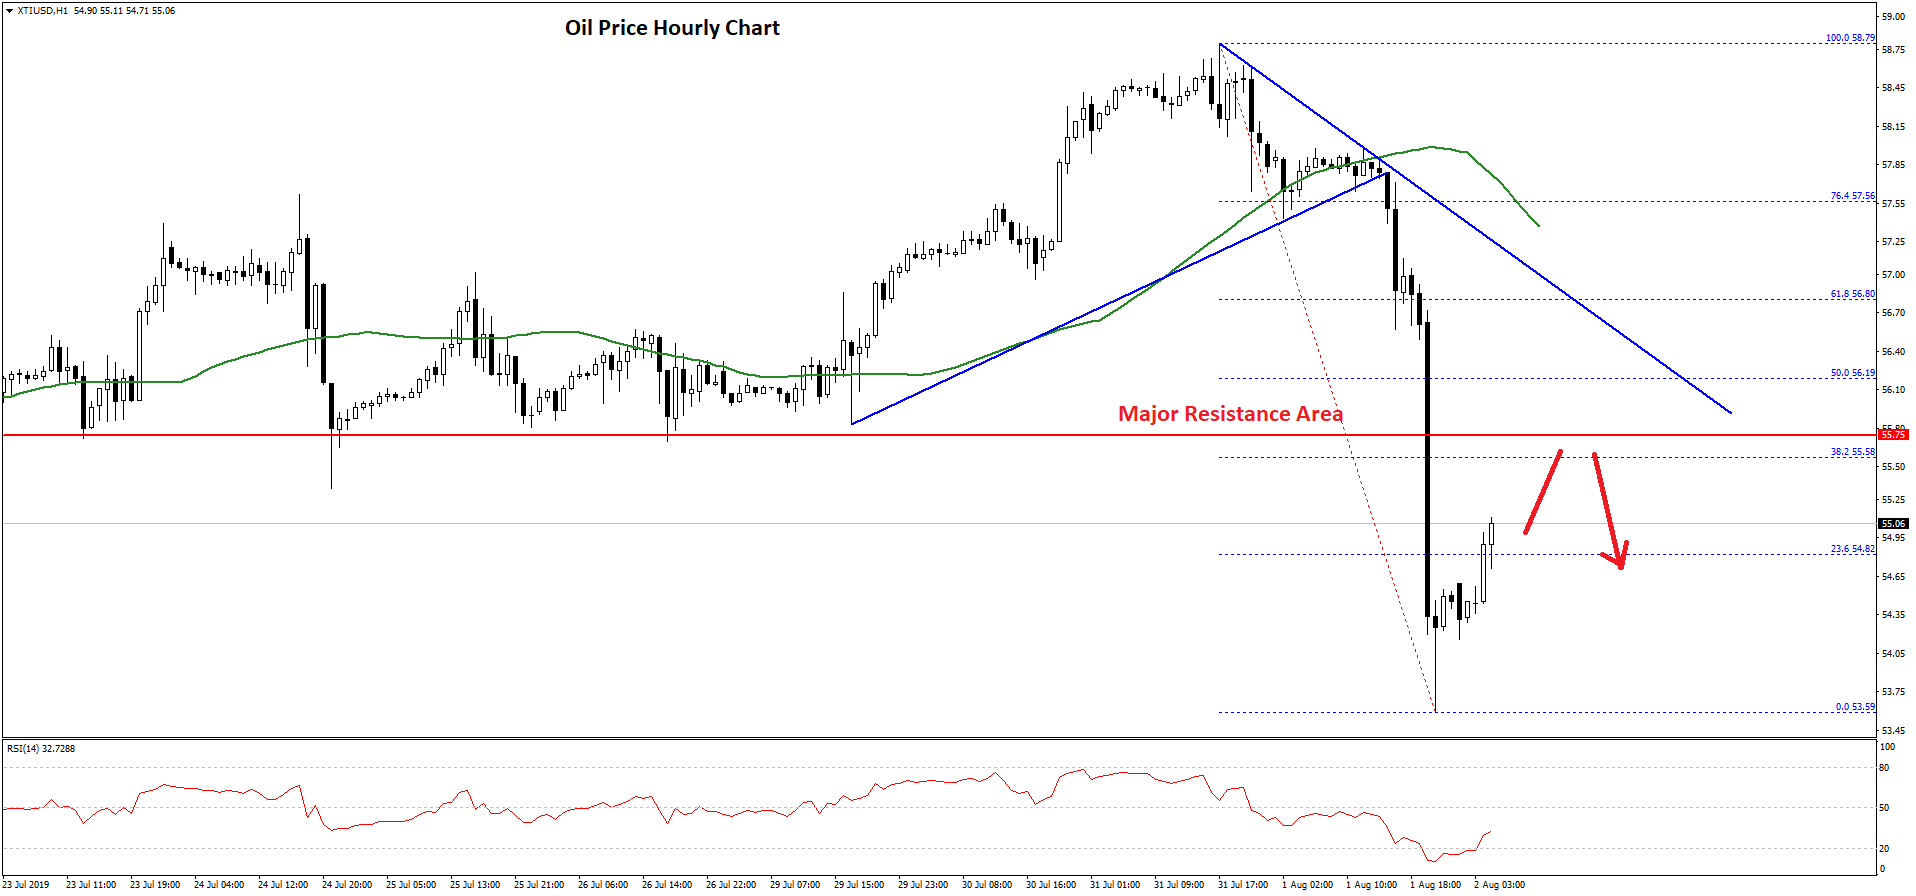
After a decent upward move, crude oil price failed to gain momentum above the $58.80 level against the US Dollar. The price topped near the $58.79 level and recently declined heavily.
It broke the $58.00 and $57.50 support levels to enter a bearish zone. Moreover, there was a break below a connecting bullish trend line on the hourly chart, $57.00, and the 50 hourly simple moving average.
Finally, the price broke the key $55.75 support level and declined towards the $53.50 level. A swing low was formed near $53.59 and the price is currently correcting higher.
It broke the $54.50 level plus the 23.6% Fib retracement level of the recent decline from the $58.79 high to $53.59 low. However, there are many hurdles on the upside near the $55.75 and $56.00 levels.
The main resistance is near $55.75, which was a support earlier. There is also a crucial bearish trend line forming with resistance near $56.20 on the hourly chart of XTI/USD.
The 50% Fib retracement level of the recent decline from the $58.79 high to $53.59 low is also near the $56.19 level to act as a strong resistance. A successful close above the $56.20 level is needed for a fresh increase.
On the downside, an immediate support is near the $54.50 level. If there are more losses, the price may revisit the $54.00 support level in the coming sessions.