Gold Price Could Decline While Oil Price Aims More Upsides
Gold price traded to a new multi-year high towards $1,818 before correcting lower. Crude oil price is currently rising and it might continue to climb as long as it is above $40.00.
Important Takeaways for Gold and Oil
- Gold price failed on more than two occasions to clear the $1,815 resistance against the US Dollar.
- There was a break below a connecting bullish trend line with support near $1,800 on the hourly chart of gold.
- Crude oil price traded to a new weekly high at $41.42 and it is currently correcting gains.
- There is a key bullish trend line forming with support near $40.45 on the hourly chart of XTI/USD.
Gold Price Technical Analysis
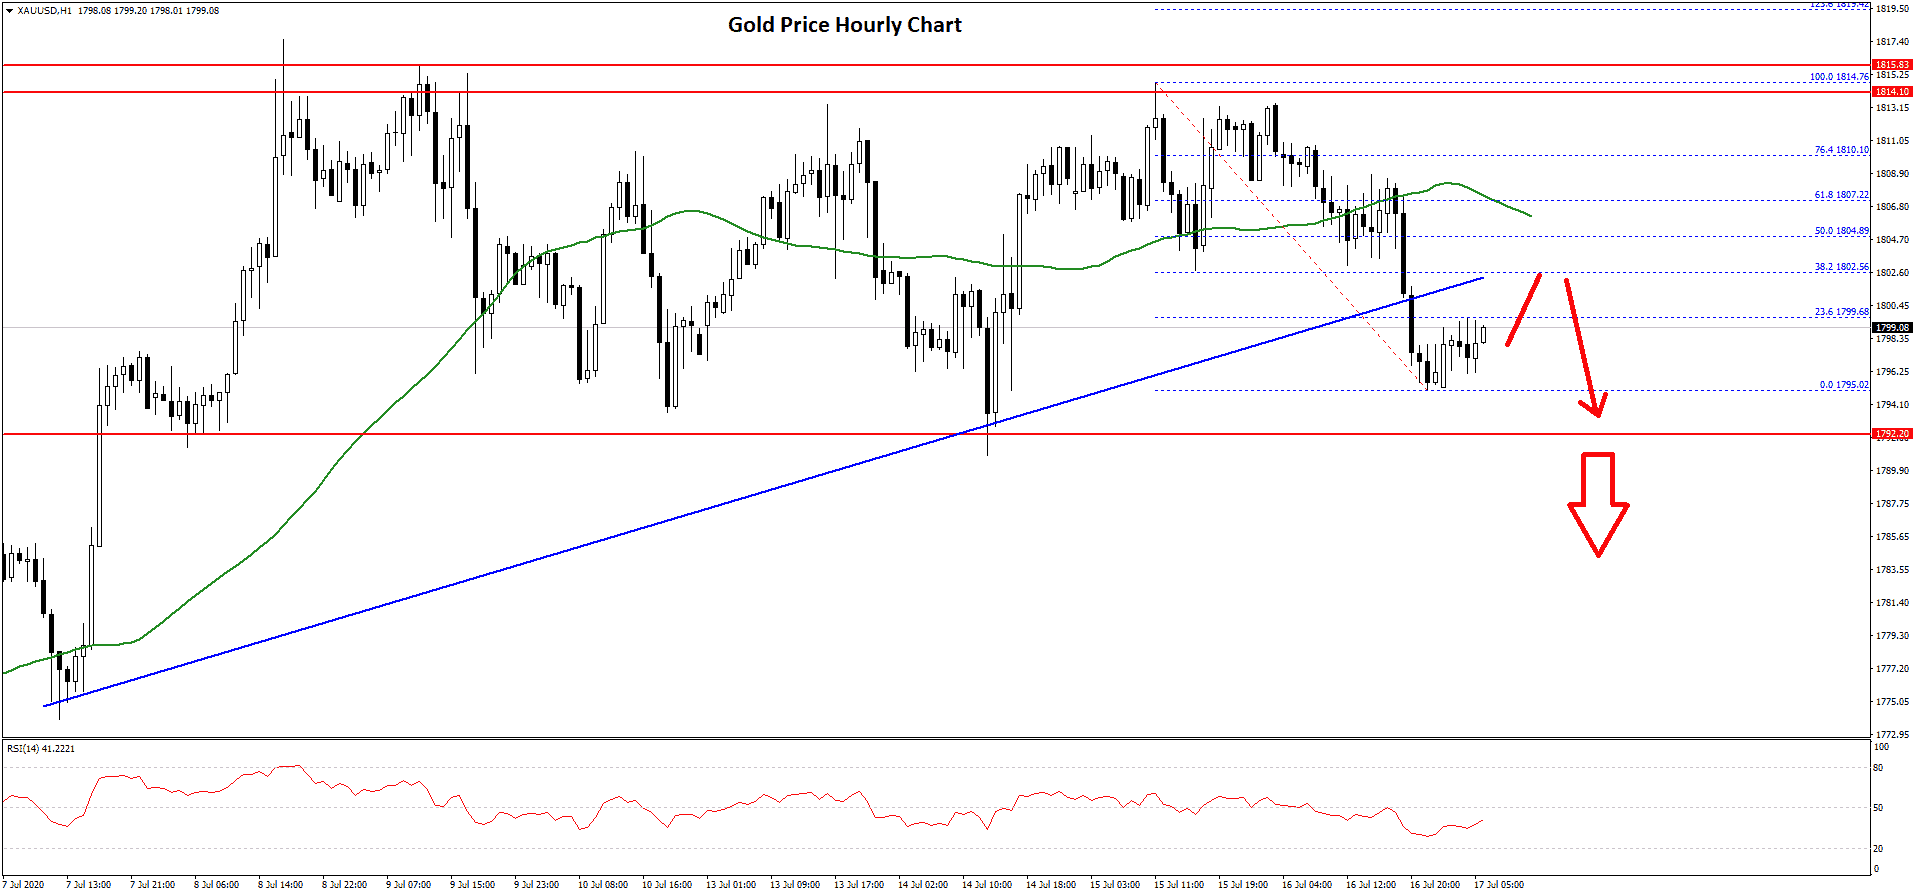
Gold price gained traction above the $1,800 resistance against the US Dollar. The price traded to a new multi-year high close to $1,818 on FXOpen, but it struggled to continue higher.
The bulls made a couple of attempts to gain strength above the $1,815 level, but they failed to push the price further gains. In the past few days, there were range moves below the $1,815 and $1,818 levels.
Recently, there was a downside correction below the $1,810 level and the 50 hourly simple moving average. Moreover, there was a break below a connecting bullish trend line with support near $1,800 on the hourly chart of gold.
The price is now trading below the $1,800 level and the recent low was formed near $1,795. On the upside, an initial resistance is near the $1,800 level. It is close to the 23.6% Fib retracement level of the recent decline from the $1,814 high to $1,795 low.
The first major resistance is near the $1,805 level or the 50 hourly simple moving average. It is close to the broken trend line and it coincides with the 50% Fib retracement level of the recent decline from the $1,814 high to $1,795 low.
The main resistance is still near the $1,815 level. A successful close above $1,815 might call for a fresh high above the $1,818 and $1,820 levels. If not, the price might decline below the $1,790 and $1,780 support levels in the near term.
Oil Price Technical Analysis
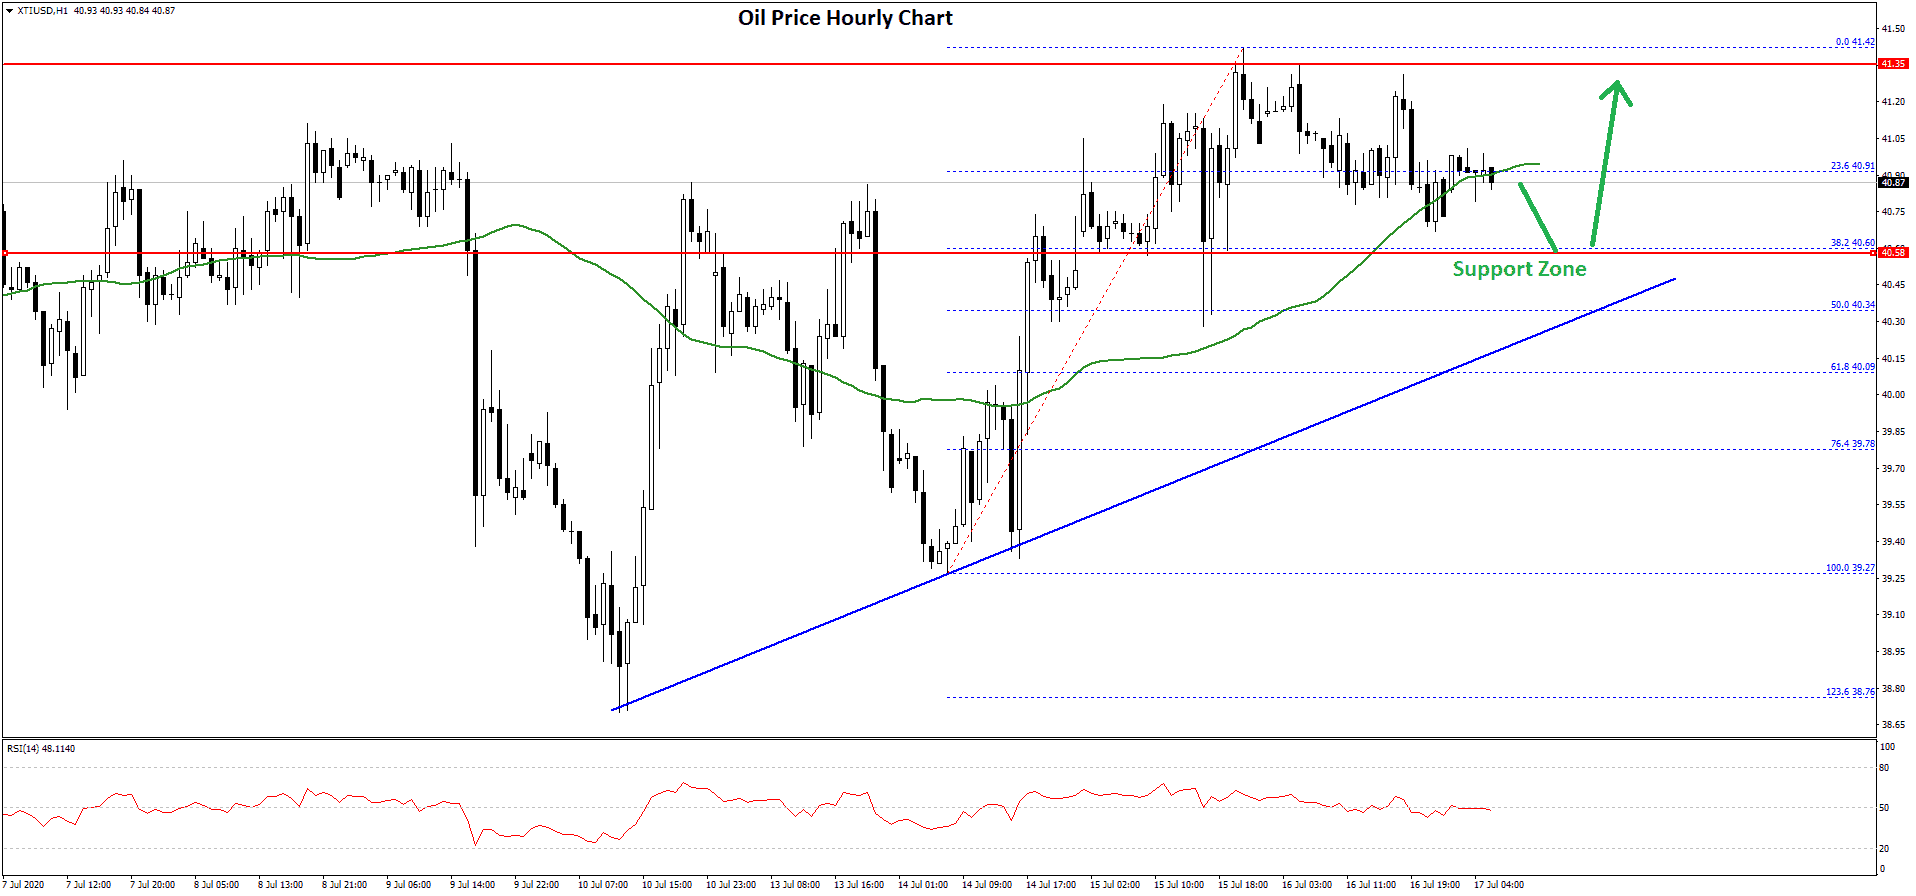
Crude oil price remained well bid above the $38.50 support zone against the US Dollar. As a result, there was an upside break above the $40.00 and $40.50 resistance levels.
The price even broke the $41.00 level and settled above the 50 hourly simple moving average. A new weekly high is formed near $41.42 and the price is currently correcting lower.
There was a break below the $41.00 level, plus the price traded below the 23.6% Fib retracement level of the recent wave from the $39.27 low to $41.42 high. The first key support is near the $40.60 level.
There is also a key bullish trend line forming with support near $40.45 on the hourly chart of XTI/USD. The trend line is close to the 50% Fib retracement level of the recent wave from the $39.27 low to $41.42 high.
Therefore, dips might find a strong buying interest near the $40.50 and $40.40 levels. Any further losses might start a major decline towards the $38.50 support.
Conversely, oil price might continue to rise above the $41.00 and $41.50 levels. The next major hurdle for the bulls could be $42.00 or $42.20.