


FXOpen

Gold price started a fresh increase above the $1,920 resistance. Crude oil price is declining and remains at a risk of more losses below $97.50
Important Takeaways for Gold and Oil
· Gold price started a fresh increase above $1,910 and $1,920 against the US Dollar.
· There is a key bearish trend line forming with resistance near $1,942 on the hourly chart of gold.
· Crude oil price started a fresh declined below the $105 support zone.
· There is a major bearish trend line forming with resistance near $102.50 on the hourly chart of XTI/USD.
Gold Price Technical Analysis
Gold price formed a support base near $1,890 and started a fresh increase against the US Dollar. The price gained pace for a move above the $1,900 level to move into a positive zone.
There was a clear move above the $1,920 level and the 50 hourly simple moving average. The price even climbed above the $1,932 resistance level. However, it faced resistance near the $1,948 and $1,950 levels.
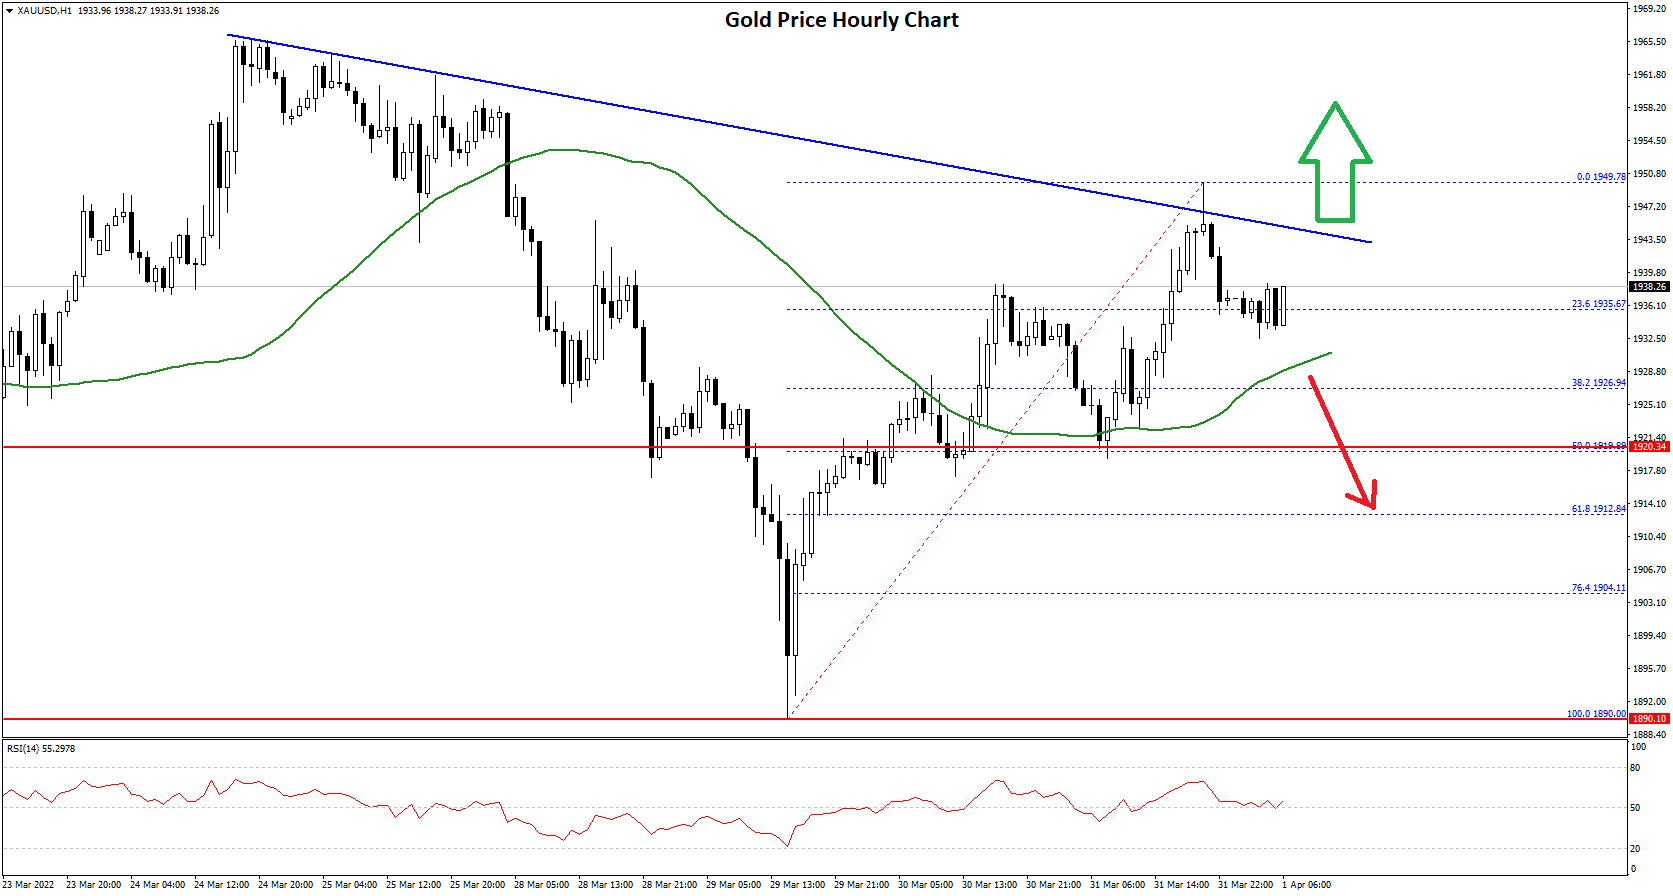
There is also a key bearish trend line forming with resistance near $1,942 on the hourly chart of gold. A high is formed near $1,949 and the price is now consolidating gains.
It tested the 23.6% Fib retracement level of the upward move from the $1,890 swing low to $1,949 high. On the downside, an initial support is near the $1,992 level and the 50 hourly simple moving average. The next major support is near the $1,925 level.
The main support sits near the $1,920 level. It is near the 50% Fib retracement level of the upward move from the $1,890 swing low to $1,949 high.
On the upside, the price is facing resistance near the $1,948 level. The main resistance is now forming near the $1,950 level. A close above the $1,950 level could open the doors for a steady increase towards $1.980. The next major resistance sits near the $2,000 level.
Oil Price Technical Analysis
Crude oil price failed to clear the $115 resistance zone against the US Dollar. The price started a major decline below the $112 and $110 support levels to enter a bearish zone.
The price even declined below the $105 support and the 50 hourly simple moving average. A There was a clear move below the 50% Fib retracement level of the upward move from the $97.72 swing low to $107.68 high.
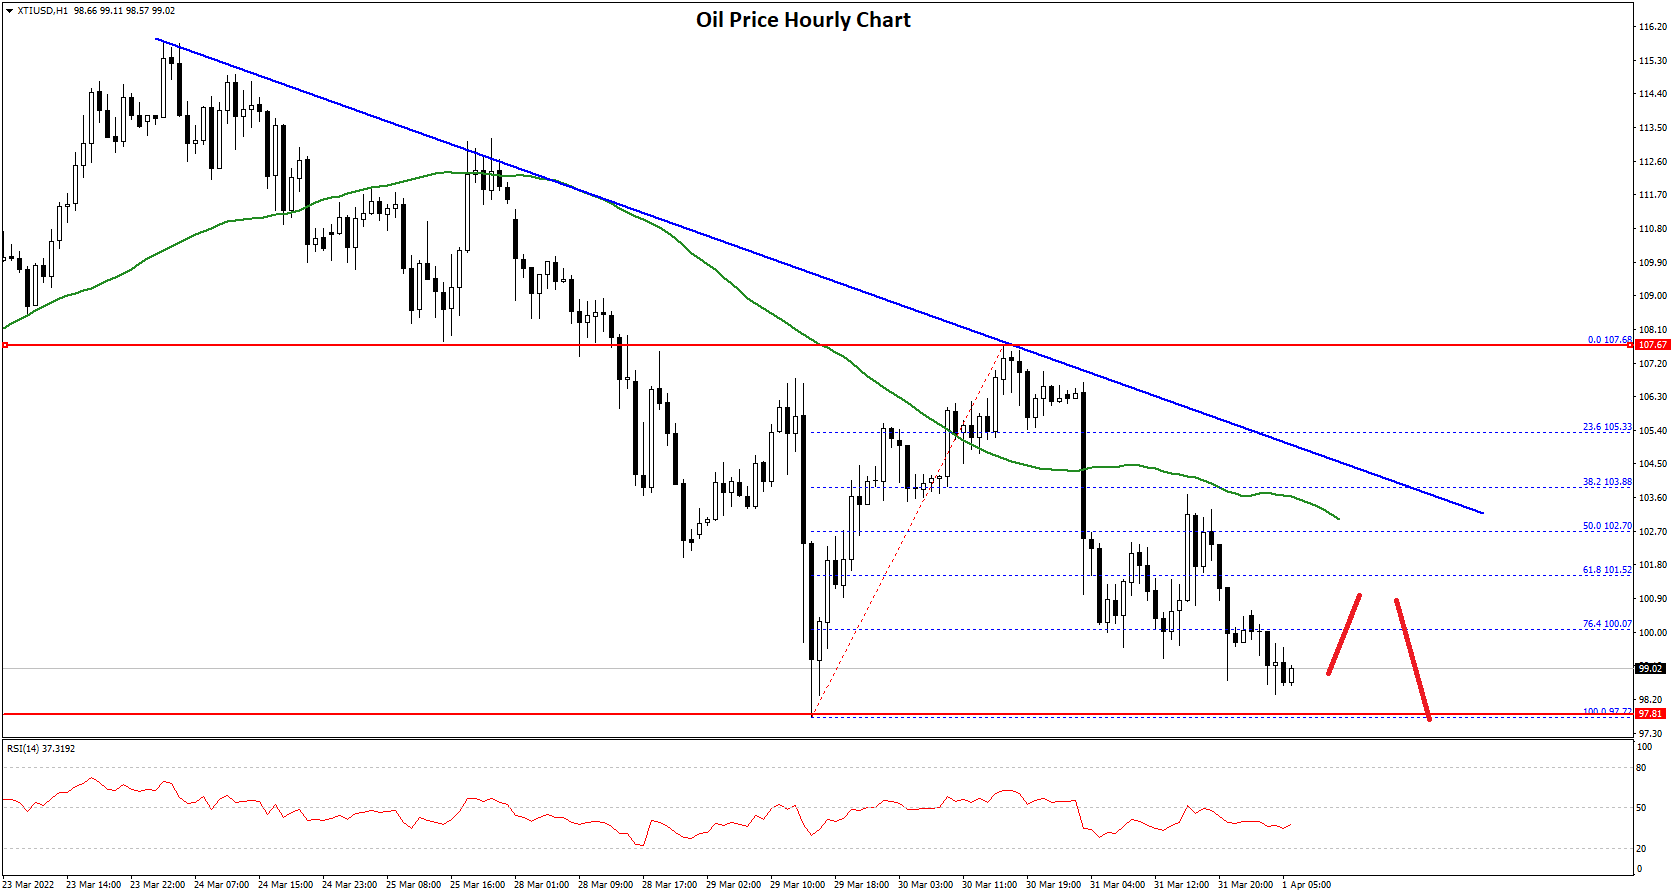
It is now trading below the $100 level. Besides, it settled below the 76.4% Fib retracement level of the upward move from the $97.72 swing low to $107.68 high.
It seems like the price could extend losses below the $97.72 low. The next major support is near the $95 level, below which there is a risk of a larger decline. On the upside, the price might face resistance near the $101.50 level.
Besides, there is a major bearish trend line forming with resistance near $102.50 on the hourly chart of XTI/USD. The next key resistance is near the $103.50 level, above which the price might accelerate higher towards $108.00.
This forecast represents FXOpen Markets Limited opinion only, it should not be construed as an offer, invitation or recommendation in respect to FXOpen Markets Limited products and services or as financial advice.
Trade over 50 forex markets 24 hours a day with FXOpen. Take advantage of low commissions, deep liquidity, and spreads from 0.0 pips (additional fees may apply). Open your FXOpen account now or learn more about trading forex with FXOpen.
This article represents the opinion of the Companies operating under the FXOpen brand only. It is not to be construed as an offer, solicitation, or recommendation with respect to products and services provided by the Companies operating under the FXOpen brand, nor is it to be considered financial advice.
Stay ahead of the market!
Subscribe now to our mailing list and receive the latest market news and insights delivered directly to your inbox.


Latest articles


XAG/USD Analysis: Silver Drops to March Low
As seen on the XAG/USD chart, the price of silver fell to the $70 level and briefly pierced it, marking the lowest level since early February.
Although geopolitical tensions typically support demand for safe-haven assets, silver is under pressure

XBR/USD Analysis: Brent Crude Rises Above $110
Yesterday, Brent crude prices moved sharply higher, with the XBR/USD chart showing breakouts above local resistance levels. Today, the price has climbed above the $110 mark, bringing it close to the multi-year high recorded on 9 March.
The bullish