Gold Price Holding Support, Oil Price Declined Sharply
Crude oil price faced a lot of selling pressure recently, resulting in a downside push below $70.00 and $68.00 support levels. On the other hand, gold price remains in an uptrend and is currently holding a key support near $1,295.00.
Important Takeaways for Gold and Oil
- Gold price corrected lower from the $1,307 swing high against the US Dollar.
- There are two bullish trend lines with a crucial support near $1,295 on the hourly chart of gold.
- Crude oil price failed to move above the $73.00 barrier and declined sharply.
- There was a sharp downside reaction below $70.00 and the price moved into a bearish trend.
Gold Price Technical Analysis
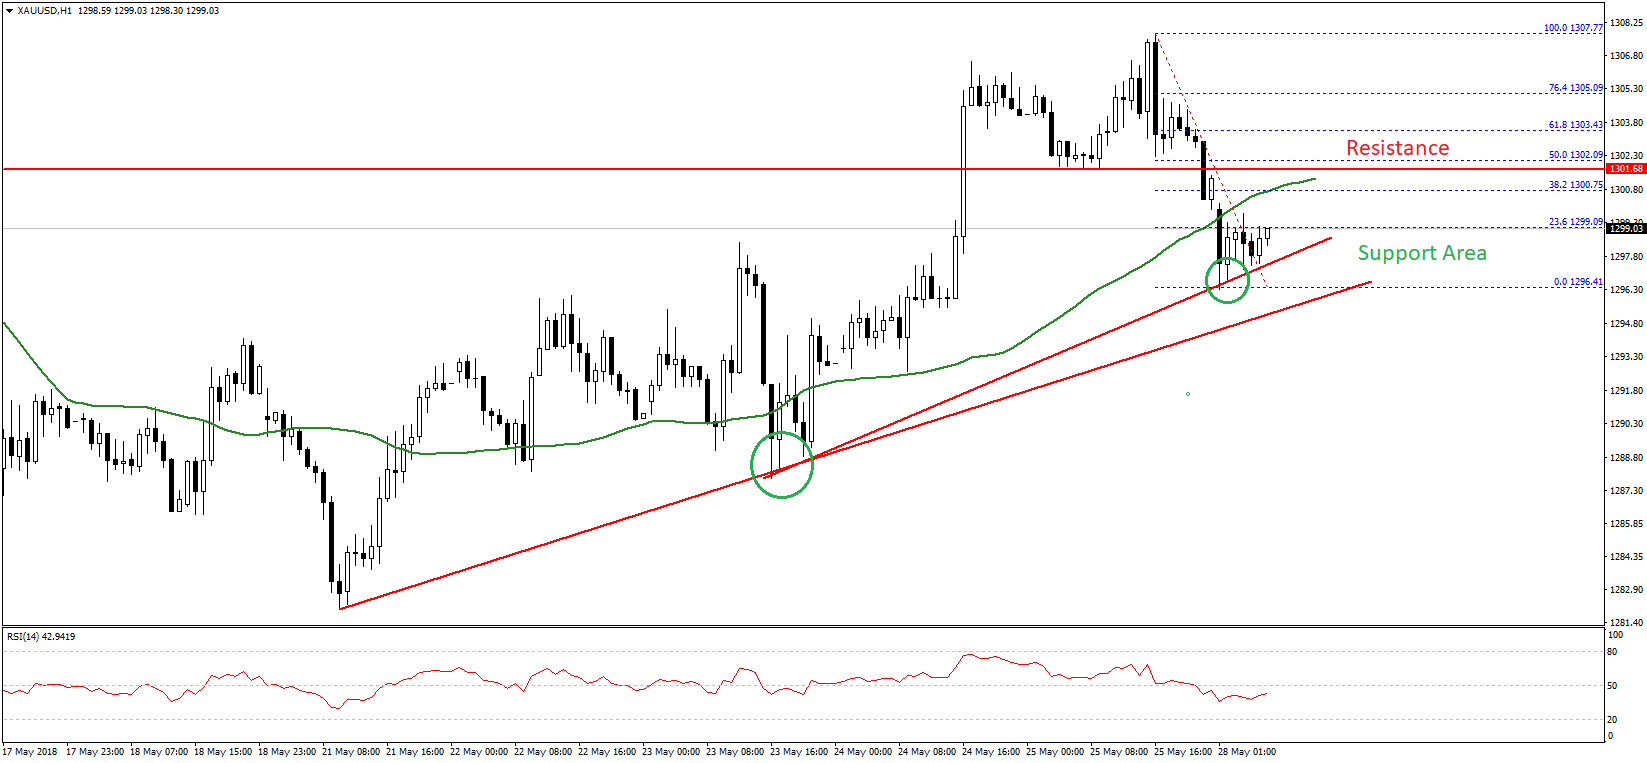
This past week, there were positive moves in gold price above the $1,280 support level against the US Dollar. The price traded higher and moved above the $1,290 and $1,300 resistance levels.
However, the price failed to test the $1,310 level and a high was formed at $1,307. Later, a downside correction was initiated and the price moved below the $1,302 and $1,300 support levels.
The decline was protected by the $1,295-1,296 support area. Moreover, there are two bullish trend lines with a crucial support near $1,295 on the hourly chart of gold. These trend lines are acting as a key support and preventing sellers from taking control below $1,295.
The recent low was $1,296 before buyers appeared. At the moment, the price is correcting higher and is testing the 23.6% Fib retracement level of the last decline from the $1,307 high to $1,296 low.
On the upside, an initial resistance is near the $1,300 level and the 50 hourly simple moving average. However, a major resistance is close to the $1,302 level, which was a support earlier. Moreover, the 50% Fib retracement level of the last decline from the $1,307 high to $1,296 low is also near $1,302.
Therefore, on the upside, a break above $1,302 is needed for a bullish acceleration. On the flip side, a close below the trend lines and the $1,295 support may perhaps open the doors for a larger downward correction.
Oil Price Technical Analysis
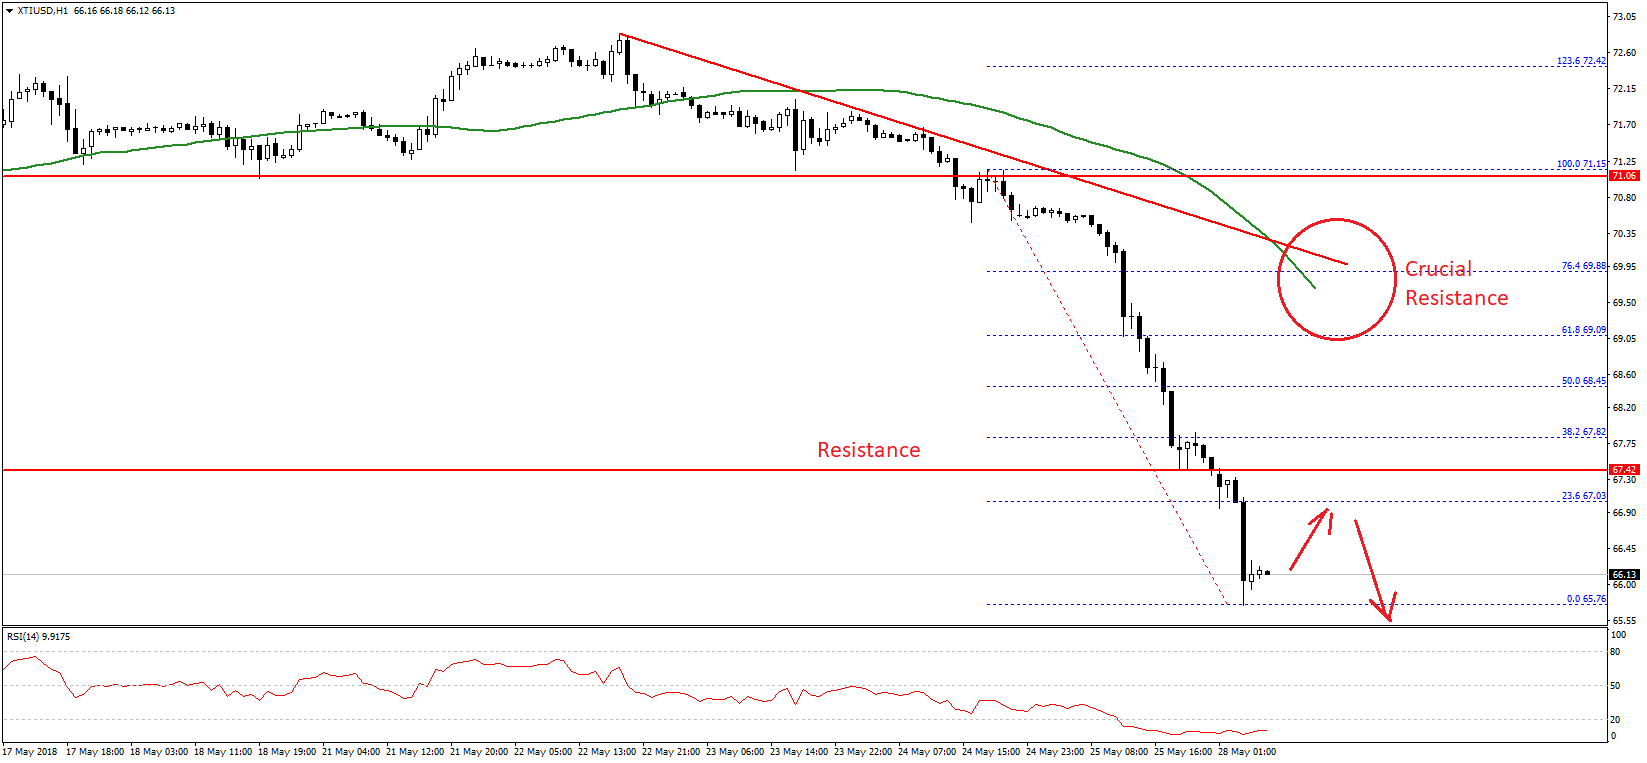
After a major bullish ride above the $70.00 level, crude oil price failed near the $73.00 level. There were ranging moves above the $70.00 level for a few sessions before the price started a downside move.
The price tumbled and broke many support levels on the way down such as $70.00, $68.00 and $67.00. It even settled below the $68.00 pivot level and the 50 hourly simple moving average.
It traded as low as $65.76 recently and is currently consolidating losses. It may correct a few points in the near term towards the 23.6% Fib retracement level of the last decline from the $71.15 high to $65.76 low.
However, there are less chances of any major upside correction above the $67.50 and $68.00 resistance levels. Should there be an upside break above $68.00, the next hurdle for buyers is near the 50% Fib retracement level of the last decline from the $71.15 high to $65.76 low at $68.50.
There is also a bearish trend line on the hourly chart with resistance at $69.80, which is positioned near the 50 hourly simple moving average. Therefore, there are many hurdles on the upside for buyers, starting with $67.50 and up to $69.80.
On the downside, a break below the $65.00 support could open the doors for a test of $60.00.