


FXOpen

Gold price is showing a lot of positive signs above the $1,660 resistance area. Crude oil price is currently sliding and it might continue to move down below $45.50
Important Takeaways for Gold and Oil
- Gold price rallied recently above the $1,650 and $1,660 resistance levels against the US Dollar.
- There is a major bullish trend line forming with support near $1,650 on the hourly chart of gold.
- Crude oil price failed to climb above the $48.80 resistance and it is currently declining.
- There is a key declining channel forming with resistance near $46.50 on the hourly chart of XTI/USD.
Gold Price Technical Analysis
This past week, gold price corrected lower sharply below the $1,600 support area against the US Dollar. However, the bulls were able to protect the $1,570 support area.
As a result, there was a fresh rally above the $1,600 and $1,620 resistance levels. Moreover, the price gained pace above the $1,650 resistance and the 50 hourly simple moving average. Finally, it broke the $1,660 resistance and traded to a weekly high at $1,676 on FXOpen.
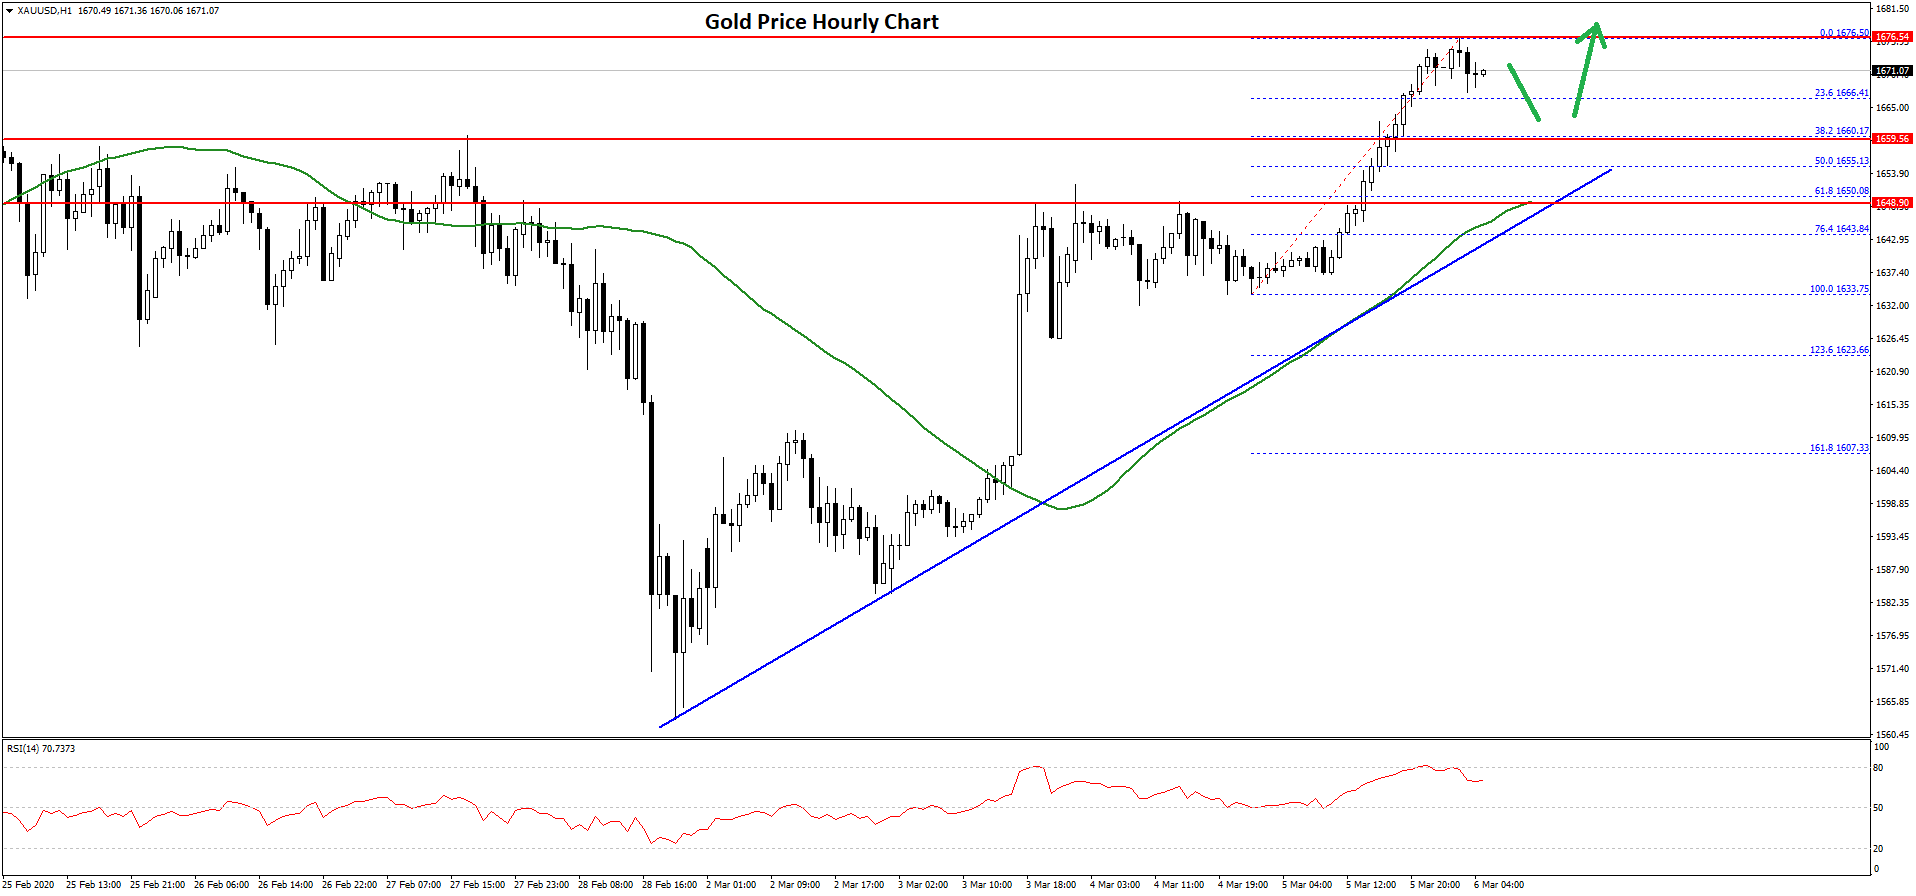
The price is currently consolidating gains and trading below $1,670. An initial support is near the $1,666 level. It is the 23.6% Fib retracement level of the recent rally from the $1,633 low to $1,676 high.
The first key support on the downside is near the $1,660 level. Moreover, there is a major bullish trend line forming with support near $1,650 on the hourly chart of gold.
An intermediate support is near the $1,655 since it is the 50% Fib retracement level of the recent rally from the $1,633 low to $1,676 high. Therefore, dips remain well supported on the downside near the $1,660 and $1,650 levels.
On the upside, an initial resistance is near the $1,675 and $1,676 levels. If gold price continues to rise, there are chances of it gaining pace above the $1,680 level. The next major hurdle is near the $1,700 level.
Oil Price Technical Analysis
Recently, crude oil price made an attempt to climb above the $48.80 and $49.00 resistance levels against the US Dollar. However, the bulls failed to gain traction and a swing high is formed near $48.69.
The price is currently declining below the $48.00 level and the 50 hourly simple moving average. Besides, there was a break below the 50% Fib retracement level of the upward move from the $43.56 low to $48.69 high.
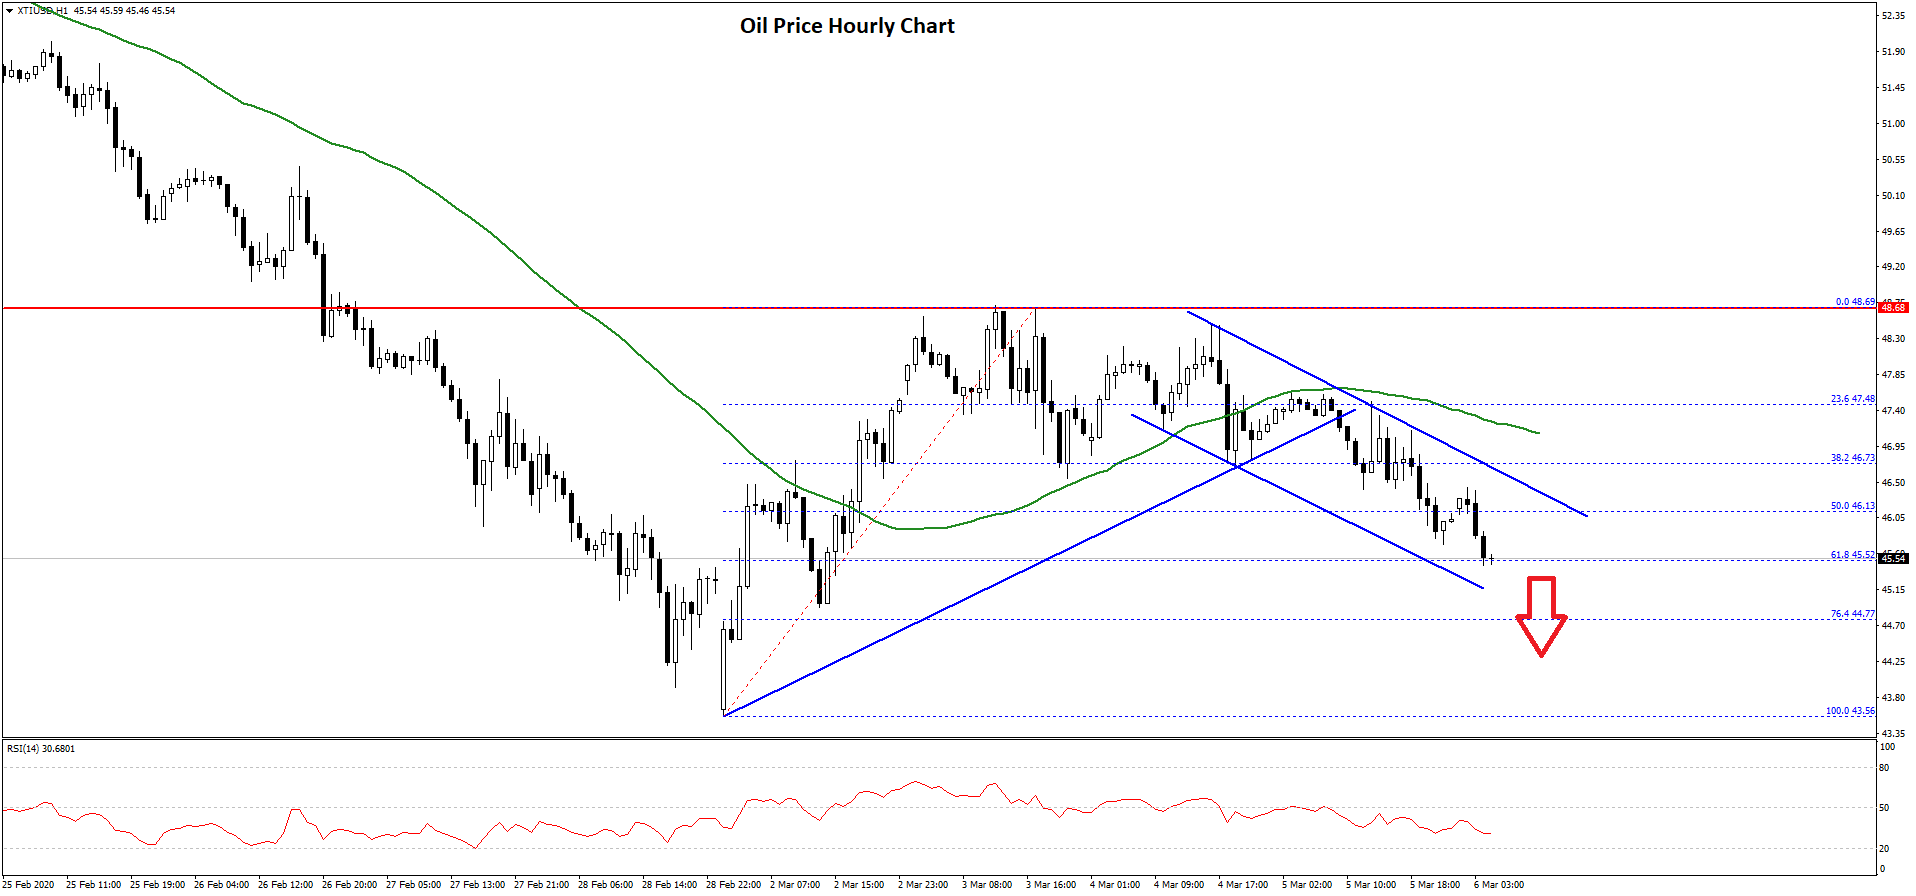
The price even declined below a major bullish trend line with support near $47.40 on the hourly chart of XTI/USD. An immediate support is seen near the $45.50 level.
The 61.8% Fib retracement level of the upward move from the $43.56 low to $48.69 high is also near the $45.50 level. If there is a downside break below the $45.50 support, there is a risk of more losses in the near term.
The next major support is near the $44.20 and $44.00 levels. Conversely, crude oil price might start a decent recovery wave above the $46.00 level. There is also a key declining channel forming with resistance near $46.50 on the same chart.
Therefore, a clear break above $46.00 and $46.50 is needed for a move towards the $48.50 level in the near term.
Trade over 50 forex markets 24 hours a day with FXOpen. Take advantage of low commissions, deep liquidity, and spreads from 0.0 pips (additional fees may apply). Open your FXOpen account now or learn more about trading forex with FXOpen.
This article represents the opinion of the Companies operating under the FXOpen brand only. It is not to be construed as an offer, solicitation, or recommendation with respect to products and services provided by the Companies operating under the FXOpen brand, nor is it to be considered financial advice.
Stay ahead of the market!
Subscribe now to our mailing list and receive the latest market news and insights delivered directly to your inbox.


Latest articles

Market Insights with Gary Thomson: USD, CAD, and Commodities in Focus
In this video, we’ll explore the key economic events and market trends, shaping the financial landscape. Get ready for insights into financial markets to help you navigate the week ahead. Let’s dive in!
In this episode of Market

USD/CHF Exchange Rate Rebounds from Multi-Year Low
The resilience of the Swiss economy and inflation remaining below 1% have made the Swiss franc an attractive safe-haven asset amid an extremely tense geopolitical backdrop and elevated gold prices. As the USD/CHF chart shows, the US dollar fell

Palantir Technologies (PLTR) Shares Show Strong Growth at the Beginning of March
Shares of Palantir Technologies (PLTR), a company specialising in big data analytics software, have become one of the stock market’s standout performers at the start of this spring.
While the closing price on the last trading day of February