Gold Price Is Rising While Crude Oil Price Is Consolidating
Gold price is trading in a positive zone above the $1,585 resistance area and it could rise further. Conversely, crude oil price is trading in a range and it could correct above $25.00.
Important Takeaways for Gold and Oil
- Gold price gained pace recently and traded above the $1,600 resistance against the US Dollar.
- There is a key bullish trend line forming with support near $1,584 on the hourly chart of gold.
- Crude oil price is still trading below the main $25.00 and $25.70 resistance levels.
- There is a major bearish trend line forming with resistance near $24.35 on the hourly chart of XTI/USD.
Gold Price Technical Analysis
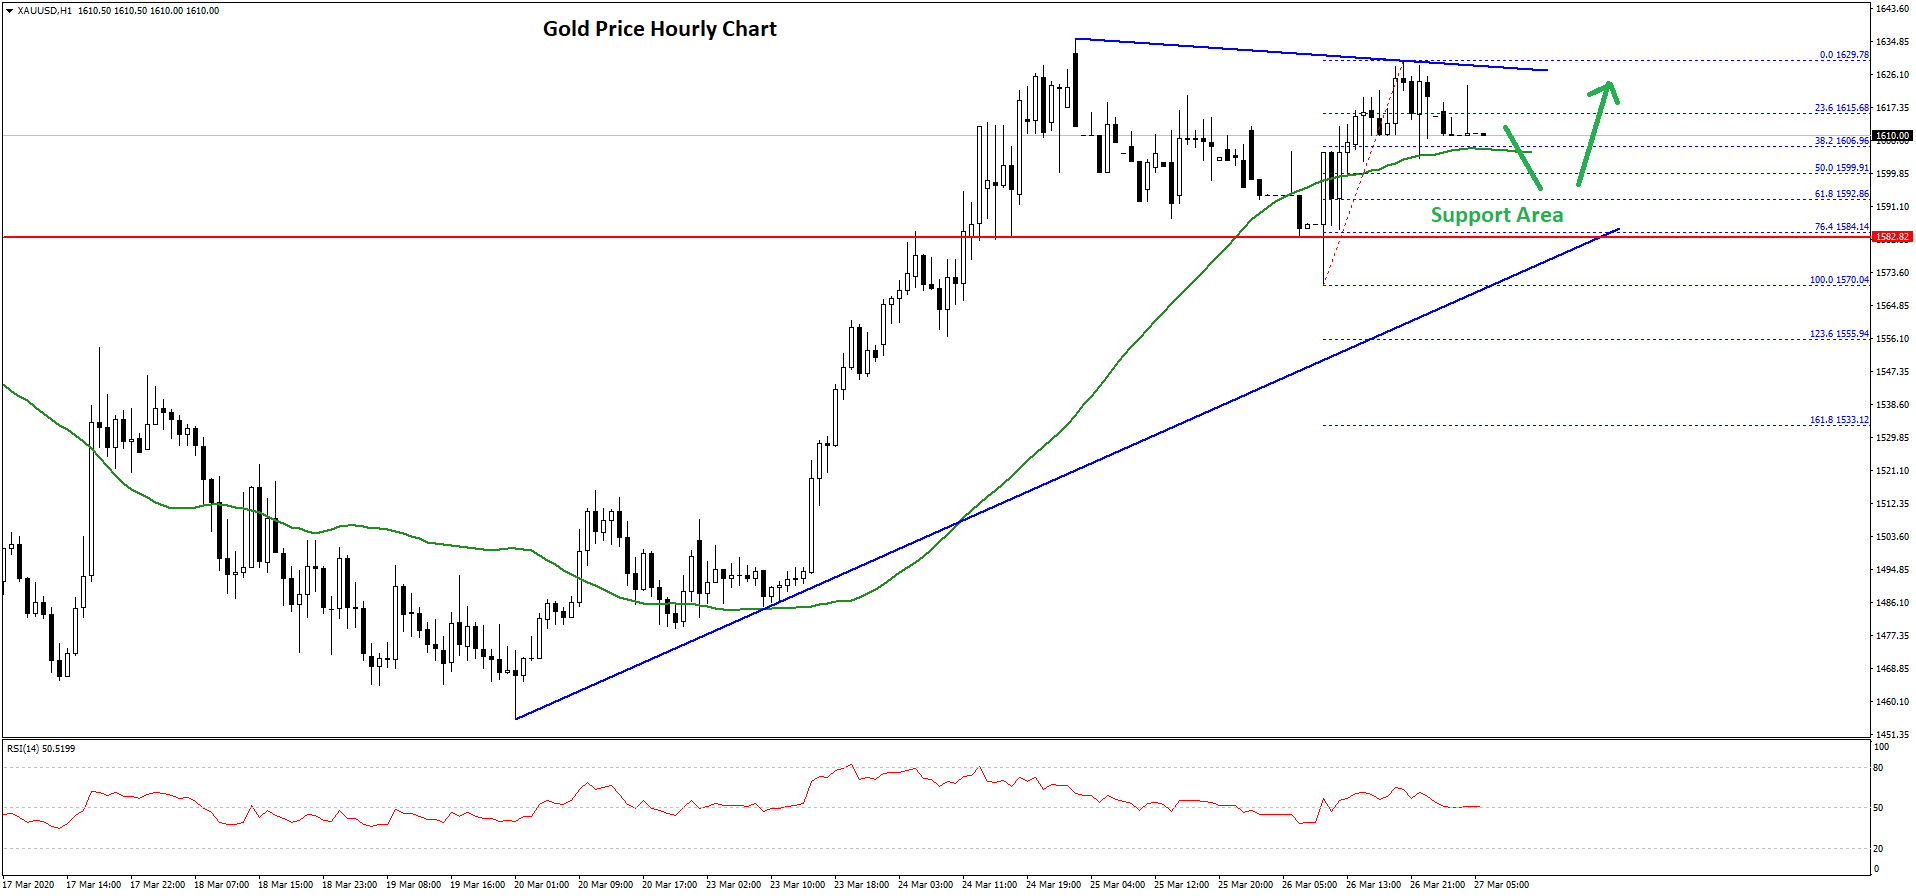
In the past few days, gold price remained in a positive zone above the $1,550 zone against the US Dollar. It traded above the $1,565 and $1,580 resistance levels to start a decent upward move.
Moreover, there was a close above the $1,585 resistance and the 50 hourly simple moving average. Finally, the price climbed above the $1,600 resistance area and traded as high as $1,629 on FXOpen.
The price is currently correcting lower below $1,620. There was a break below the 23.6% Fib retracement level of the recent rise from the $1,570 low to $1,629 high.
On the downside, an initial support is near the $1,606 level and the 50 hourly simple moving average. The next major support is near the $1,600 level. It is close to the 50% Fib retracement level of the recent rise from the $1,570 low to $1,629 high.
There is also a key bullish trend line forming with support near $1,584 on the hourly chart of gold. Clearly, the $1,584 area is an important support zone for the bulls in the near term.
If there is a downside break below the $1,585 and $1,584 support levels, there could be a nasty decline. The next major support is near the $1,555 level, below which there is a risk of more downsides towards $1,530.
Conversely, the price may perhaps rise above the $1,620 and $1,625 resistance levels. Any further gains could lead the price towards the $1,650 level in the near term.
Oil Price Technical Analysis
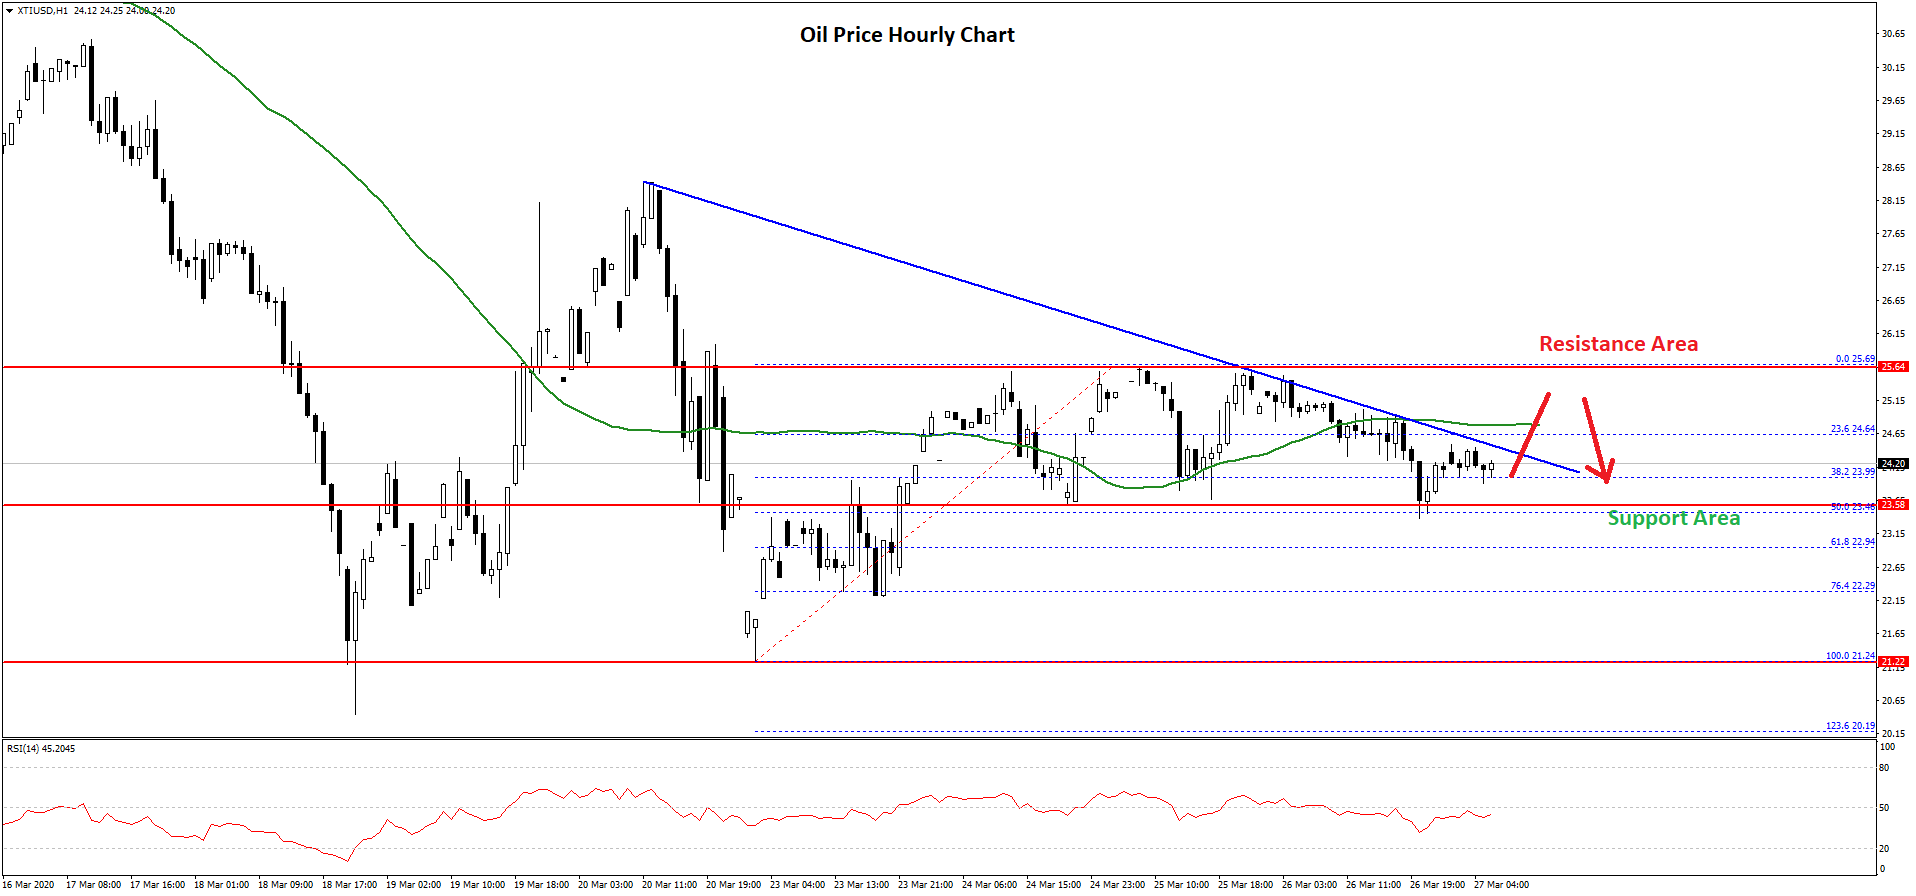
Recently, crude oil price started an upside correction from the $21.24 low against the US Dollar. The price was able to recover above the $22.00 and $22.50 resistance levels.
Moreover, it surpassed the $25.00 level and the 50 hourly simple moving average. However, the price failed to continue higher above the $25.70 level.
A swing high is formed near the $25.69 level and the price is currently correcting lower. It broke the 23.6% Fib retracement level of the upward move from the $21.24 low to $25.69 high.
On the downside, the $23.60 area is acting as a decent support. The 50% Fib retracement level of the upward move from the $21.24 low to $25.69 high is also near the $23.60 area.
If the price fails to stay above the $23.60 support, it could decline back towards the $22.50 and $22.00 support levels.
Conversely, the price could make another attempt to rise above $25.00 and $25.70. There is also a major bearish trend line forming with resistance near $24.35 on the hourly chart of XTI/USD.
Therefore, a clear break above the $24.40, $25.00 and $25.70 resistance levels is needed for a strong rise.