Gold Price Rallies Above $1,800, Oil Price Prepares For Next Move
Gold price started a fresh increase and it cleared the $1,800 resistance zone. Crude oil price is trading nicely above $64.50 and it is likely setting up for the next move.
Important Takeaways for Gold and Oil
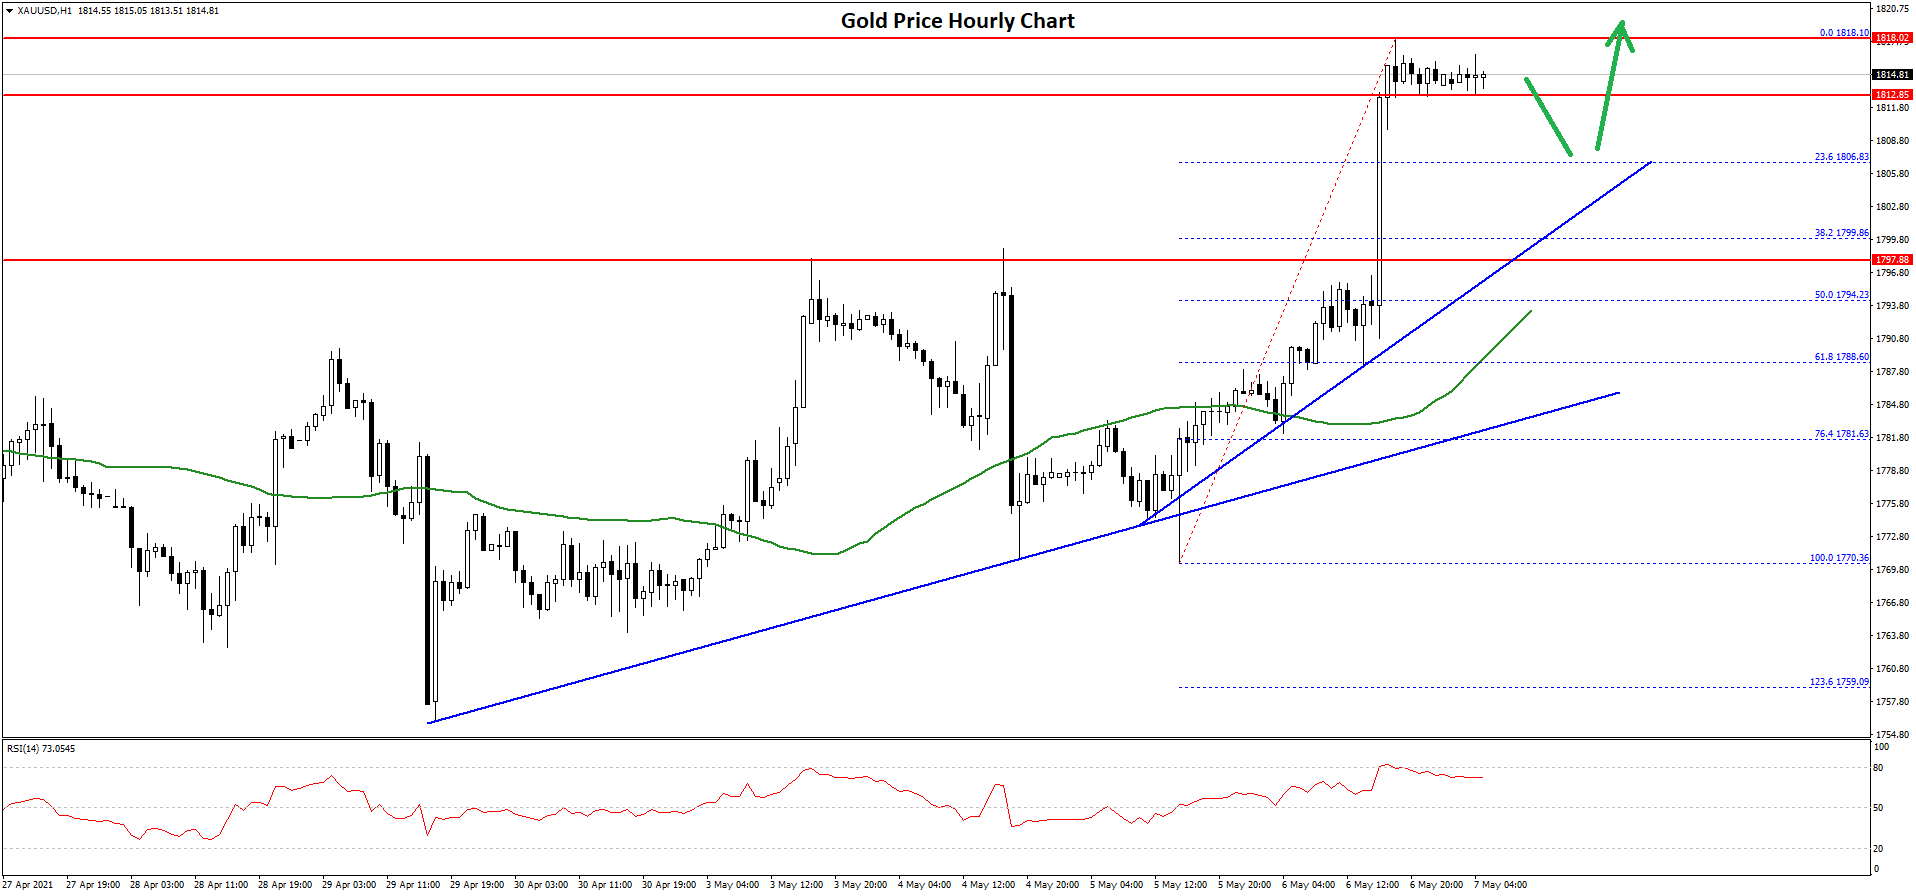
- Gold price gained pace above the $1,790 and $1,800 resistance levels against the US Dollar.
- There is a key bullish trend line forming with support near $1,805 on the hourly chart of gold.
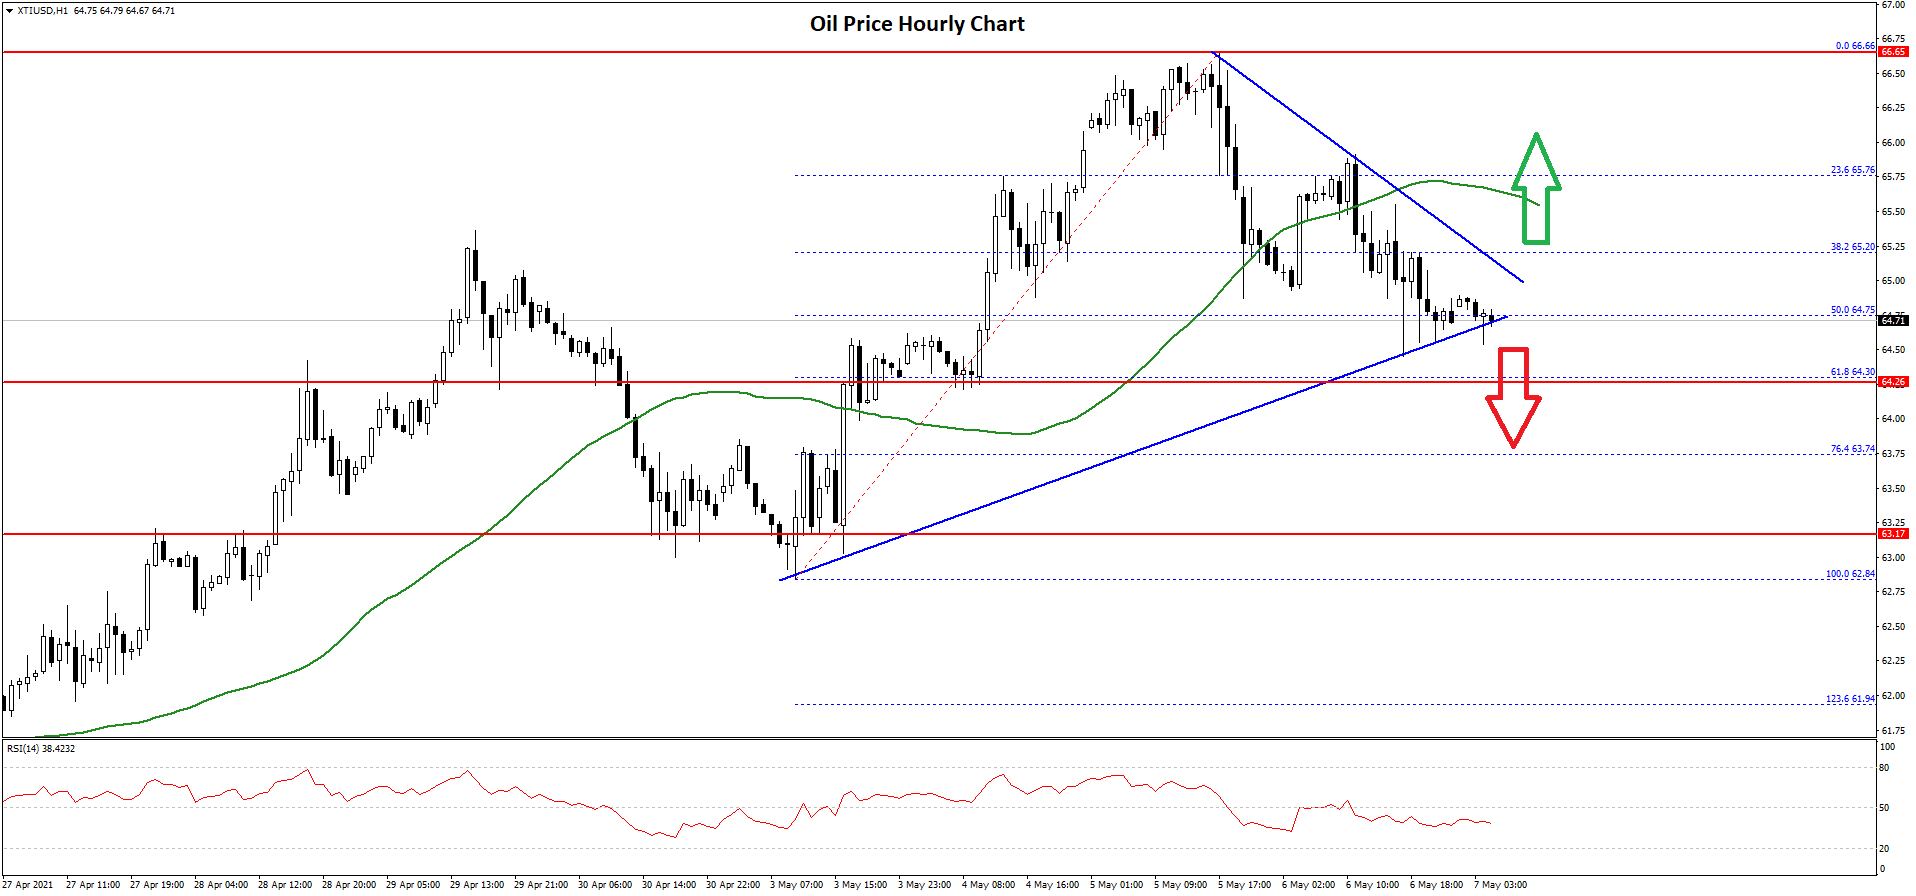
- Crude oil price climbed higher and tested the $66.65 zone before correcting lower.
- There is a crucial contracting triangle forming with support near $64.70 on the hourly chart of XTI/USD.
Gold Price Technical Analysis
This week, gold price formed a strong support base above the $1,760 level against the US Dollar. As a result, there was a fresh increase above the $1,780 and $1,800 resistance levels.
The price even settled above the $1,800 zone and the 50 hourly simple moving average. It spiked above the $1,815 level and a high was formed near $1,818 on FXOpen. The price is now consolidating near the $1,815 level.
An initial support on the downside is near the $1,805 zone. There is also a key bullish trend line forming with support near $1,805 on the hourly chart of gold.
The trend line is close to the 23.6% Fib retracement level of the recent wave from the $1,770 low to $1,818 high. If there are more losses, the price could decline towards the $1,800 level. The next key support could be near the $1,795 level.
The 50% Fib retracement level of the recent wave from the $1,770 low to $1,818 high is also near the $1,795 zone. Besides, the 50 hourly simple moving average is near the $1,792 level.
On the upside, an immediate resistance is near the $1,818 and $1,820 levels. A clear break above the $1,820 level may possibly open the doors for a move towards the $1,850 level.
Oil Price Technical Analysis
Crude oil price remained well supported above the $62.00 zone against the US Dollar. As a result, the price started a fresh increase above the $64.00 resistance zone.
The price was able to surge above the $64.50 and $65.00 levels. There was also a break above the $65.50 resistance and the 50 hourly simple moving average. A high is formed near $66.66 before the price corrected lower.
There was a break below the 23.6% Fib retracement level of the recent move from the $62.84 low to $66.66 high. The price is now trading well below $65.50 and the 50 hourly simple moving average.
It is trading near the 50% Fib retracement level of the recent move from the $62.84 low to $66.66 high. There is also a crucial contracting triangle forming with support near $64.70 on the hourly chart of XTI/USD.
If there is a downside break below the triangle support, the price could test the $64.30 support. Any more losses may possibly lead the price towards the $63.20 support zone.
On the upside, the price is facing resistance near the $65.00 level. If there is an upside break above $65.00, the price could test $65.50 and the 50 hourly SMA. The next major resistance is near the $66.65 level.
This forecast represents FXOpen Markets Limited opinion only, it should not be construed as an offer, invitation or recommendation in respect to FXOpen Markets Limited products and services or as financial advice.