Gold Price Recovering While Crude Oil Price Plunging
Gold price managed to recover and settled above the $1,550 support area. However, crude oil price declined heavily and it recently broke the $56.00 support area.
Important Takeaways for Gold and Oil
- Gold price remained well bid above $1,550 and it recently climbed towards $1,565 against the US Dollar.
- There is a major bullish trend line forming with support near $1,555 on the hourly chart of gold.
- Crude oil price is facing an increase in selling pressure and declined below $58.00 and $56.00.
- There is a key bearish trend line forming with resistance near $56.60 on the hourly chart of XTI/USD.
Gold Price Technical Analysis
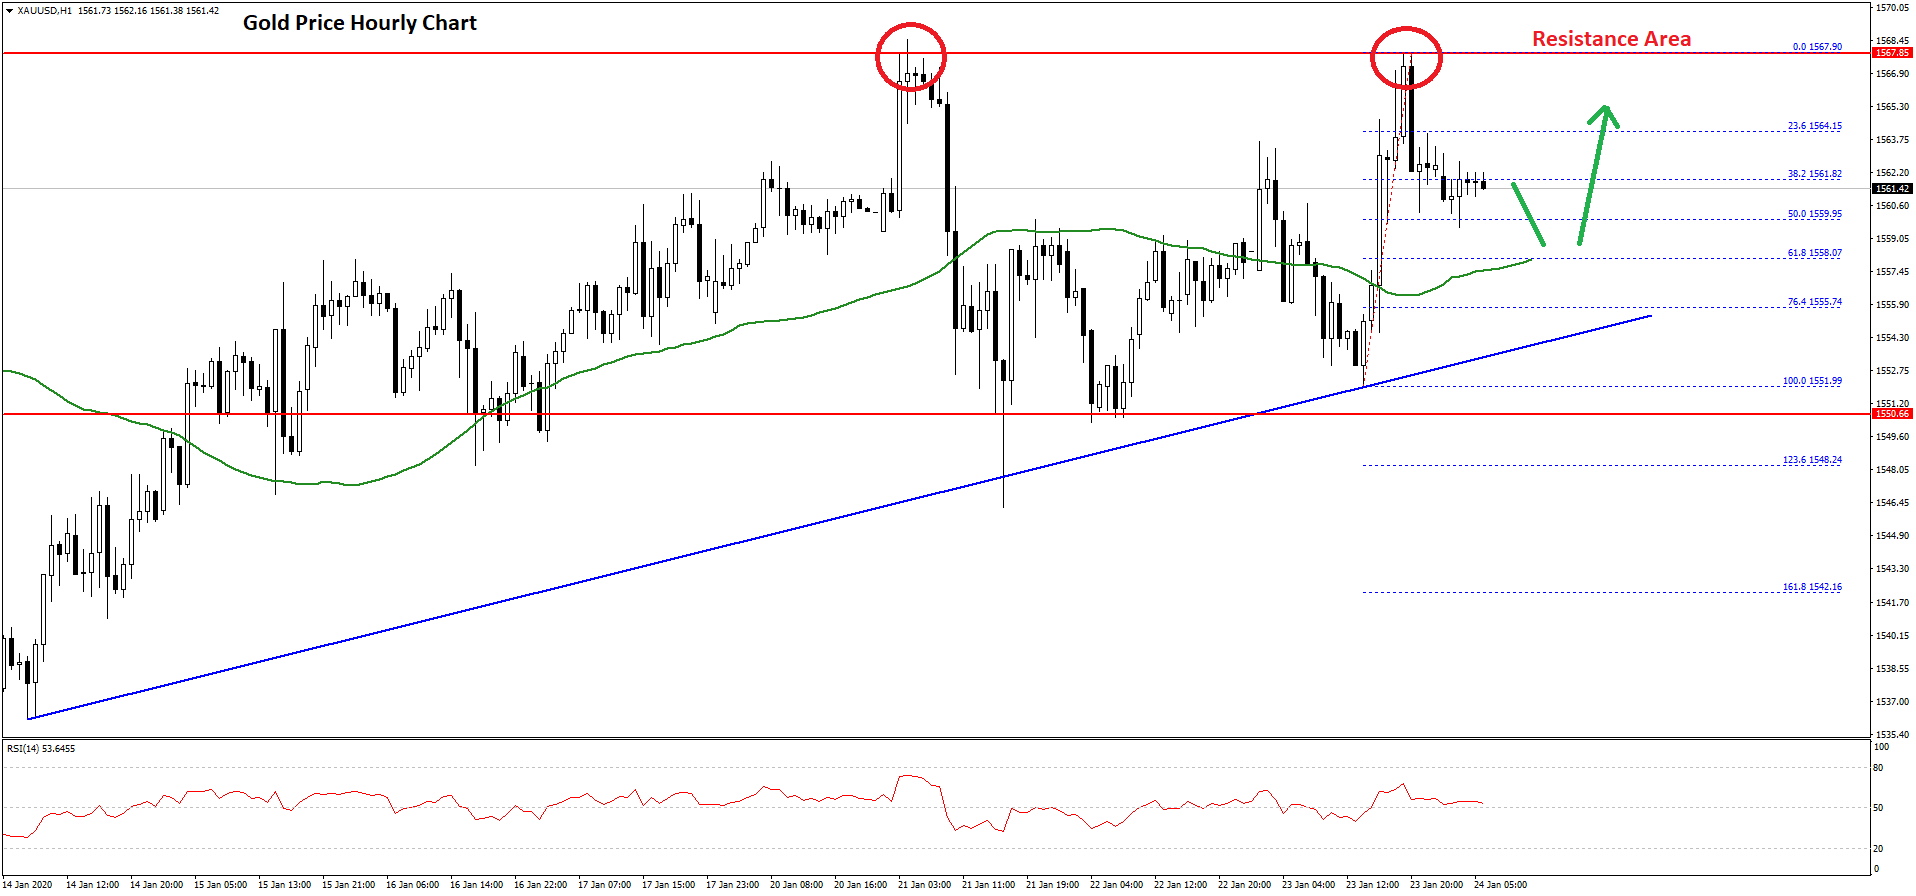
After a steady decline, gold price found support near the $1,532 and $1,535 levels against the US Dollar. As a result, the price started a decent upward move and settled above the $1,550 resistance area.
It even surpassed the $1,560 resistance and the 50 hourly simple moving average. However, the bulls struggled to clear the $1,565 and $1,568 resistance levels.
The price was rejected on two occasions near $1,568 and the recent high was formed near $1,567 on FXOpen. It is currently correcting lower and trading below the $1,562 support.
Besides, there was a break below the 23.6% Fib retracement level of the recent wave from the $1,551 low to $1,567 high. On the downside, the first key support is near the $1,558 level.
Furthermore, the 50% Fib retracement level of the recent wave from the $1,551 low to $1,567 high is also near the $1,559 level and the 50 hourly simple moving average.
More importantly, there is a major bullish trend line forming with support near $1,555 on the hourly chart of gold. Therefore, dips remain well supported on the downside near the $1,558 and $1,555 levels.
The main support is near the $1,550 level, below which gold price might turn bearish and decline towards $1,535. On the upside, there is a strong resistance near $1,567 and $1,568, above which the bulls are likely to aim $1,575 in the near term.
Oil Price Technical Analysis
In the past few days, there was a sharp decline in crude oil price from well above the $58.00 level against the US Dollar. The price broke many supports near the $57.20 and $56.50 levels to enter a bearish zone.
Moreover, there was a close below the $56.00 level and the 50 hourly simple moving average. Finally, it declined below the $55.50 level and traded to a new weekly low at $54.77.
It is currently correcting higher above the $55.00 level. There was a break above the 23.6% Fib retracement level of the recent slide from the $58.74 high to $54.77 low.
On the upside, there is a strong resistance forming near the $56.50 level and the 50 hourly simple moving average. Moreover, there is a key bearish trend line forming with resistance near $56.60 on the hourly chart of XTI/USD.
The 50% Fib retracement level of the recent slide from the $58.74 high to $54.77 low is also near $56.75. Therefore, crude oil price must surpass the $56.50-$57.75 resistance area to start a decent recovery in the near term.
If not, there is a risk of more losses below the $55.20 and $54.80 levels in the coming sessions.