Gold Price Settles Above $1,800 While Oil Price Turns Red
Gold price rallied to a new multi-year high above $1,815 before correcting lower. Crude oil price is currently declining and trading in a bearish zone below $40.00.
Important Takeaways for Gold and Oil
- Gold price extended its upward move and traded a new multi-year high at $1,817 against the US Dollar.
- There is a crucial bullish trend line forming with support near $1,795 on the hourly chart of gold.
- Crude oil price started a fresh decline after it failed to gain strength above $41.00.
- There was a break below a major bullish trend line with support near $40.65 on the hourly chart of XTI/USD.
Gold Price Technical Analysis
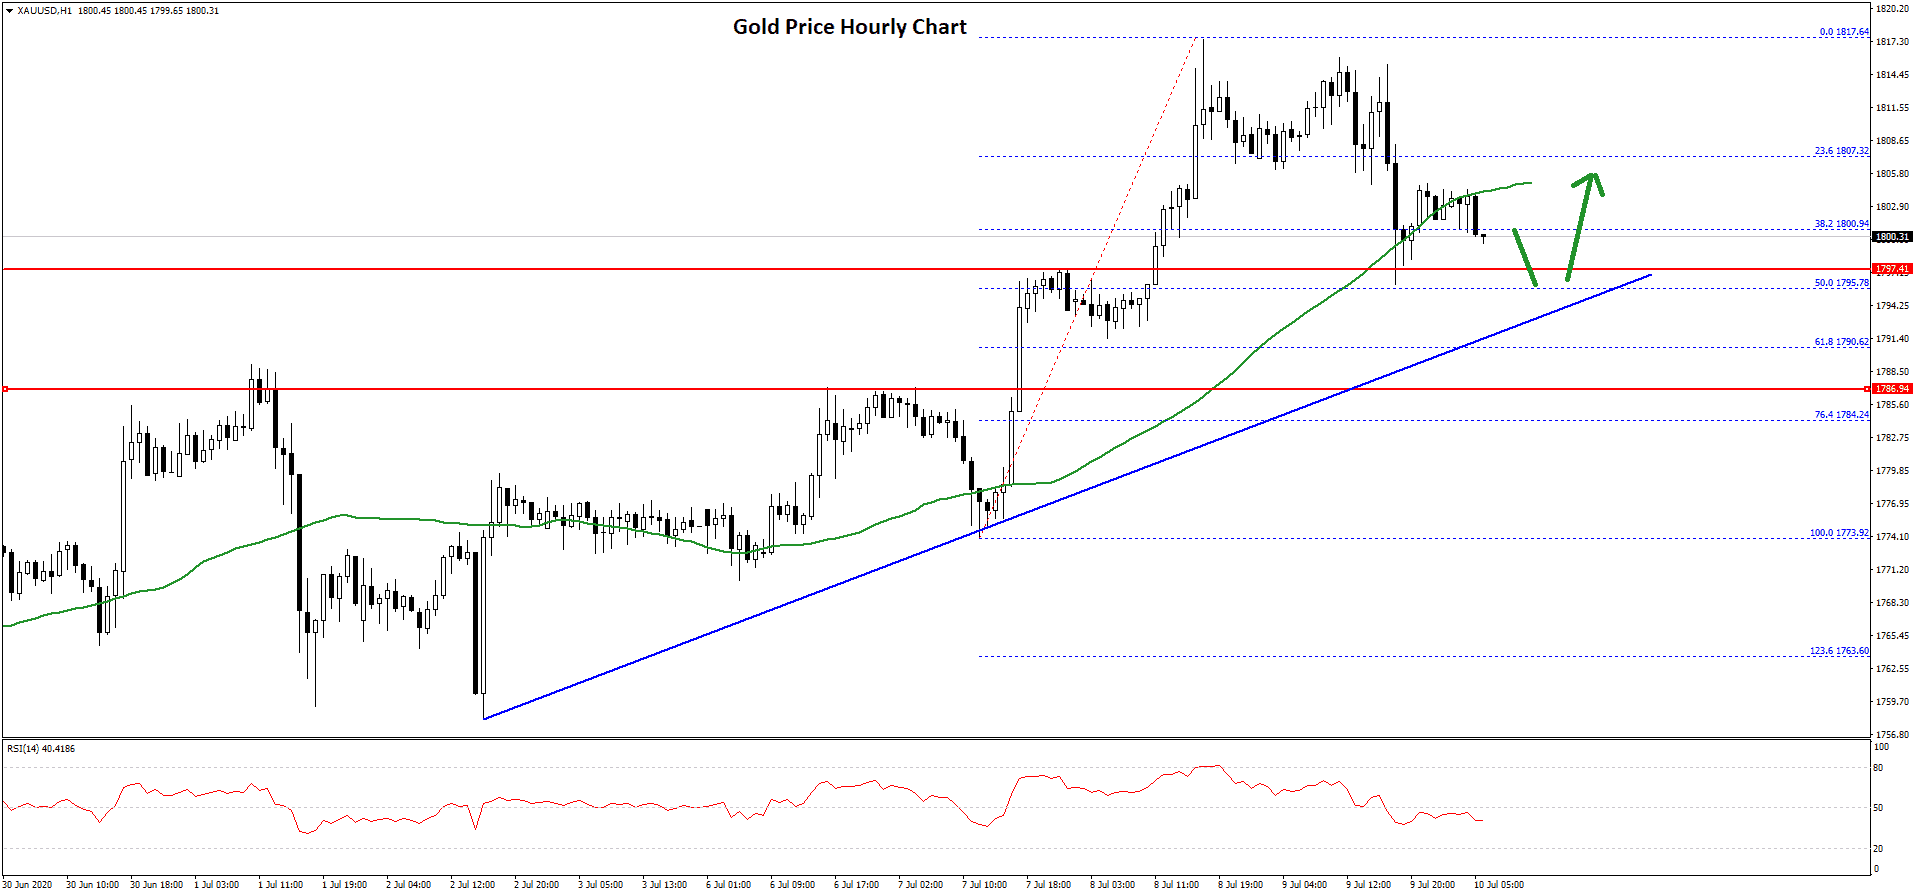
Gold price remained in a strong uptrend and it managed to climb above the $1,780 and $1,800 resistance levels against the US Dollar. The price traded to a new multi-year high at $1,817 on FXOpen.
Recently, it started a downside correction from the $1,817 high. There was a break below the $1,812 and $1,810 support levels. The price traded below the 23.6% Fib retracement level of the upward move from the $1,773 low to $1,817 high.
There was a close below the $1,805 level and the 50 hourly simple moving average. However, the $1,800 region is currently acting as a support. There is also a crucial bullish trend line forming with support near $1,795 on the hourly chart of gold.
The trend line coincides with the 50% Fib retracement level of the upward move from the $1,773 low to $1,817 high. If the bulls fail to protect the trend line support, there is a risk of a larger decline.
The next major support is near the $1,785 level. Any further losses may perhaps lead the price towards the $1,760 level. On the upside, the price is facing hurdles near the $1,805 and $1,808 levels.
The main resistance is now near the $1,815 level, above which the bulls might aim a break above the $1,825 level in the near term.
Oil Price Technical Analysis
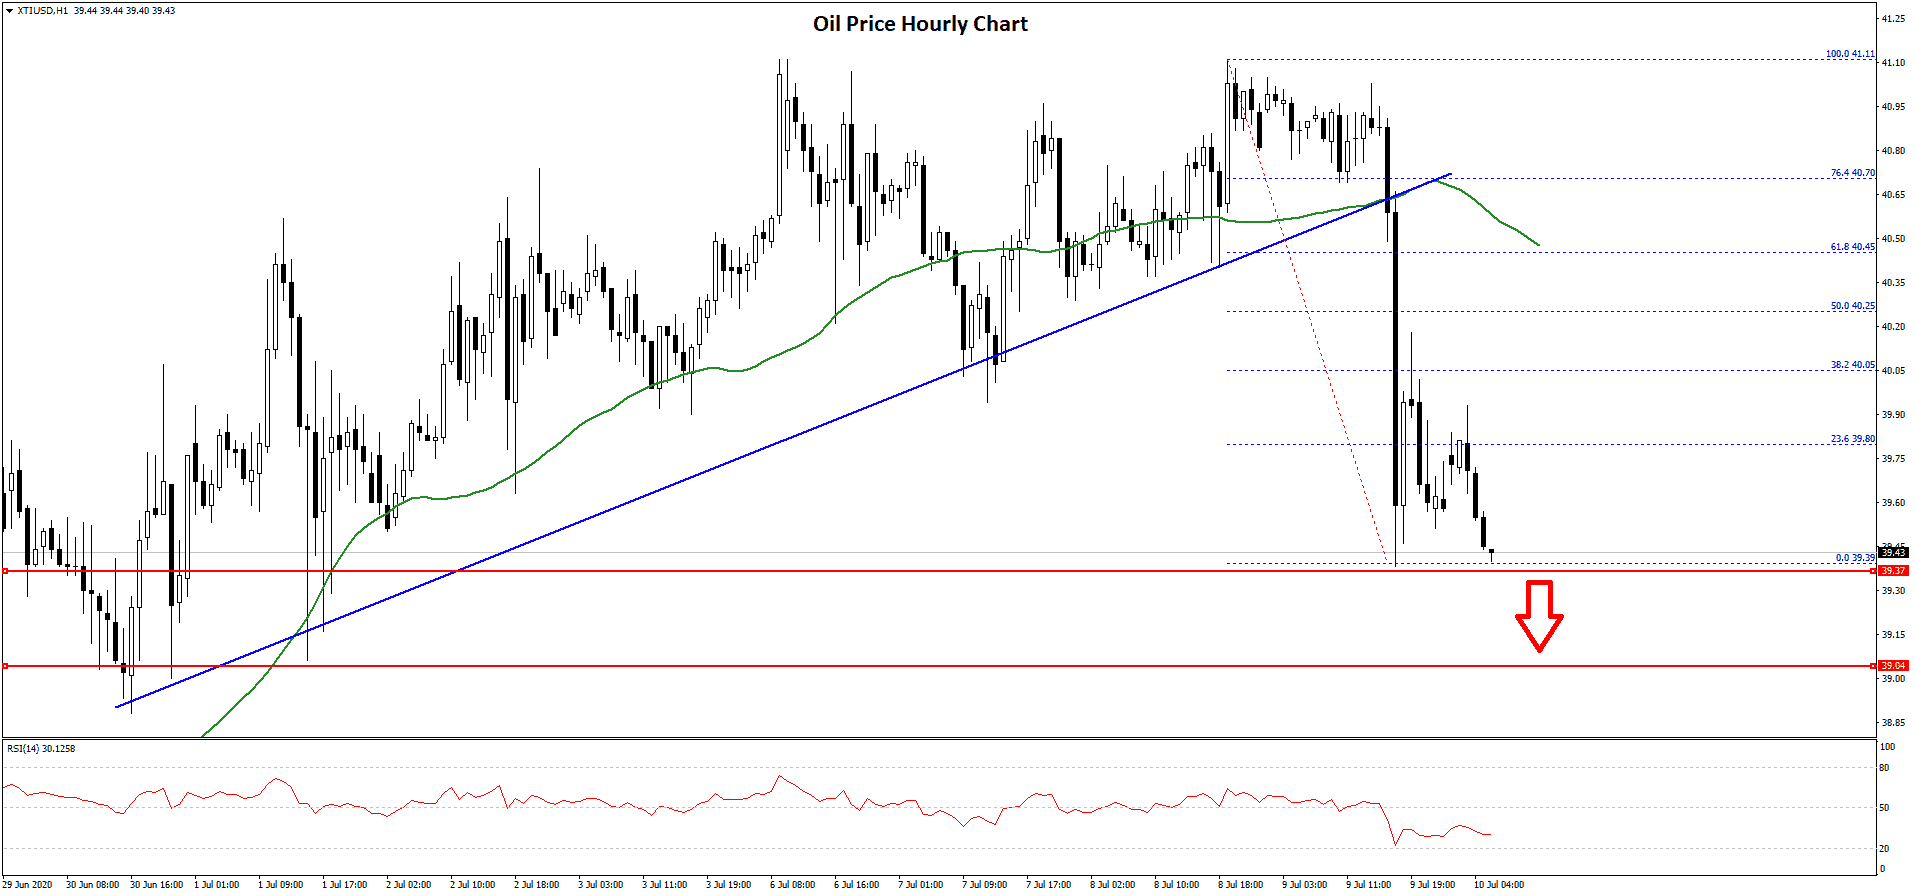
Crude oil price made a couple of attempts to clear the $41.00 and $41.10 resistance levels against the US Dollar. However, there was no upside break and the price started a fresh decline from the $41.11 swing high.
It broke the $40.80 and $40.60 support levels to move into a short term bearish zone. Moreover, there was a break below a major bullish trend line with support near $40.65 on the hourly chart of XTI/USD.
The price traded below the $39.80 level and settled well below the 50 hourly simple moving average. A low is formed near $39.39 and the price is currently consolidating losses.
An initial resistance is near the $39.80 level or the 23.6% Fib retracement level of the recent decline from the $41.11 high to $39.39 low. The first major resistance on the upside is near the $40.00 level.
The next major resistance could be near $40.50, the 50 hourly simple moving average, and the 50% Fib retracement level of the recent decline from the $41.11 high to $39.39 low. A successful close above $40.00 and then a follow through move above $40.50 is needed for a fresh increase.
Conversely, the price might resume its decline below the $39.40 and $39.20 levels. The main support is near the $39.00 level, below which the price could test the $38.20 level.