Gold Price Slides Below $1,700, Oil Price Approaches $65
Gold price started a fresh decline below the $1,750 and $1,720 support levels. Crude oil price is still in a positive zone and it is approaching the $65.00 resistance.
Important Takeaways for Gold and Oil
- Gold price started a steady decline and it even broke the $1,700 support against the US Dollar.
- There is a major declining channel forming with resistance near $1,715 on the hourly chart of gold.
- Crude oil price traded to a new multi-month high near $64.96.
- There was a break above a key bearish trend line with resistance near $61.50 on the hourly chart of XTI/USD.
Gold Price Technical Analysis
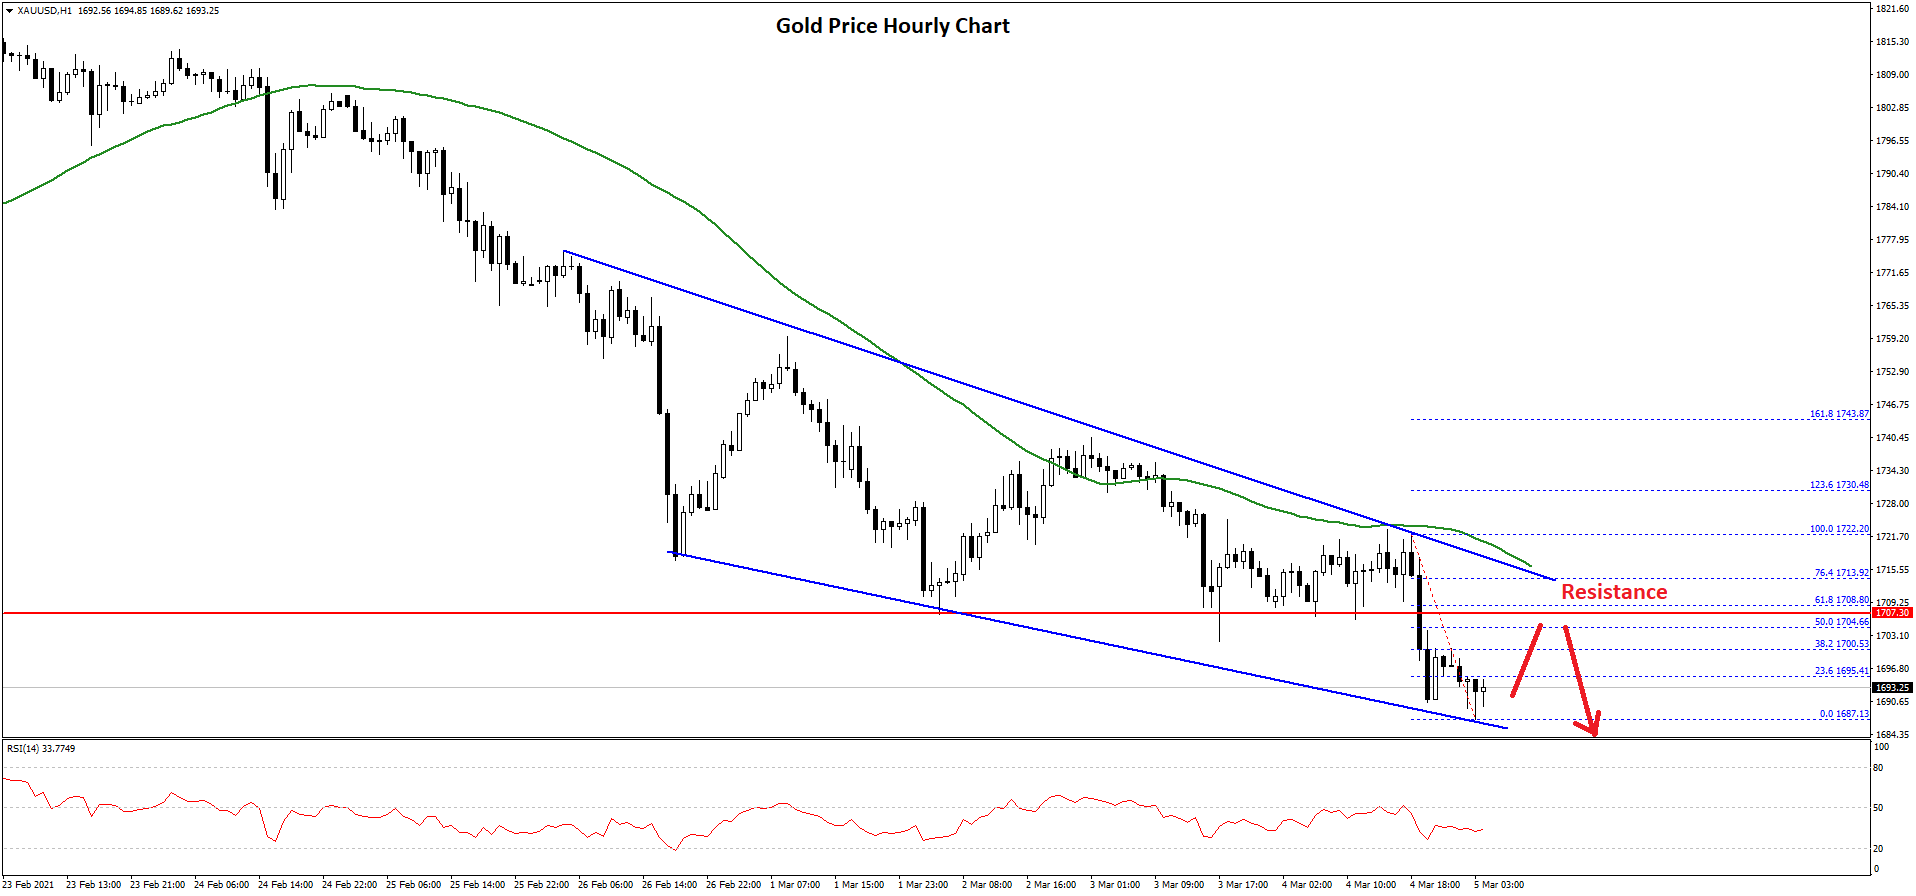
Gold price struggled to stay above the $1,750 support and started a strong decline against the US Dollar. As a result, there was a break below the $1,720 and $1,715 support levels.
The price even declined below the $1,700 support and settled below the 50 hourly simple moving average. It traded as low as $1,687 on FXOpen and it is currently consolidating losses.
An initial resistance on the upside is near the $1,700 level. It is close to the 38.2% Fib retracement level of the recent decline from the $1,722 swing high to $1,687 low. The first major resistance is near the $1,710 level.
An intermediate resistance is near $1,705. It is close to the 50% Fib retracement level of the recent decline from the $1,722 swing high to $1,687 low. There is also a major declining channel forming with resistance near $1,715 on the hourly chart of gold.
The trend line is close to the 50 hourly simple moving average at $1,716. A close above the trend line resistance and a follow up move above $1,720 is needed for a fresh surge.
On the downside, the first major support is near the $1,688 level. The next major support is near the $1,675 level. Any more losses might call for a move towards the $1,650 support level.
Oil Price Technical Analysis
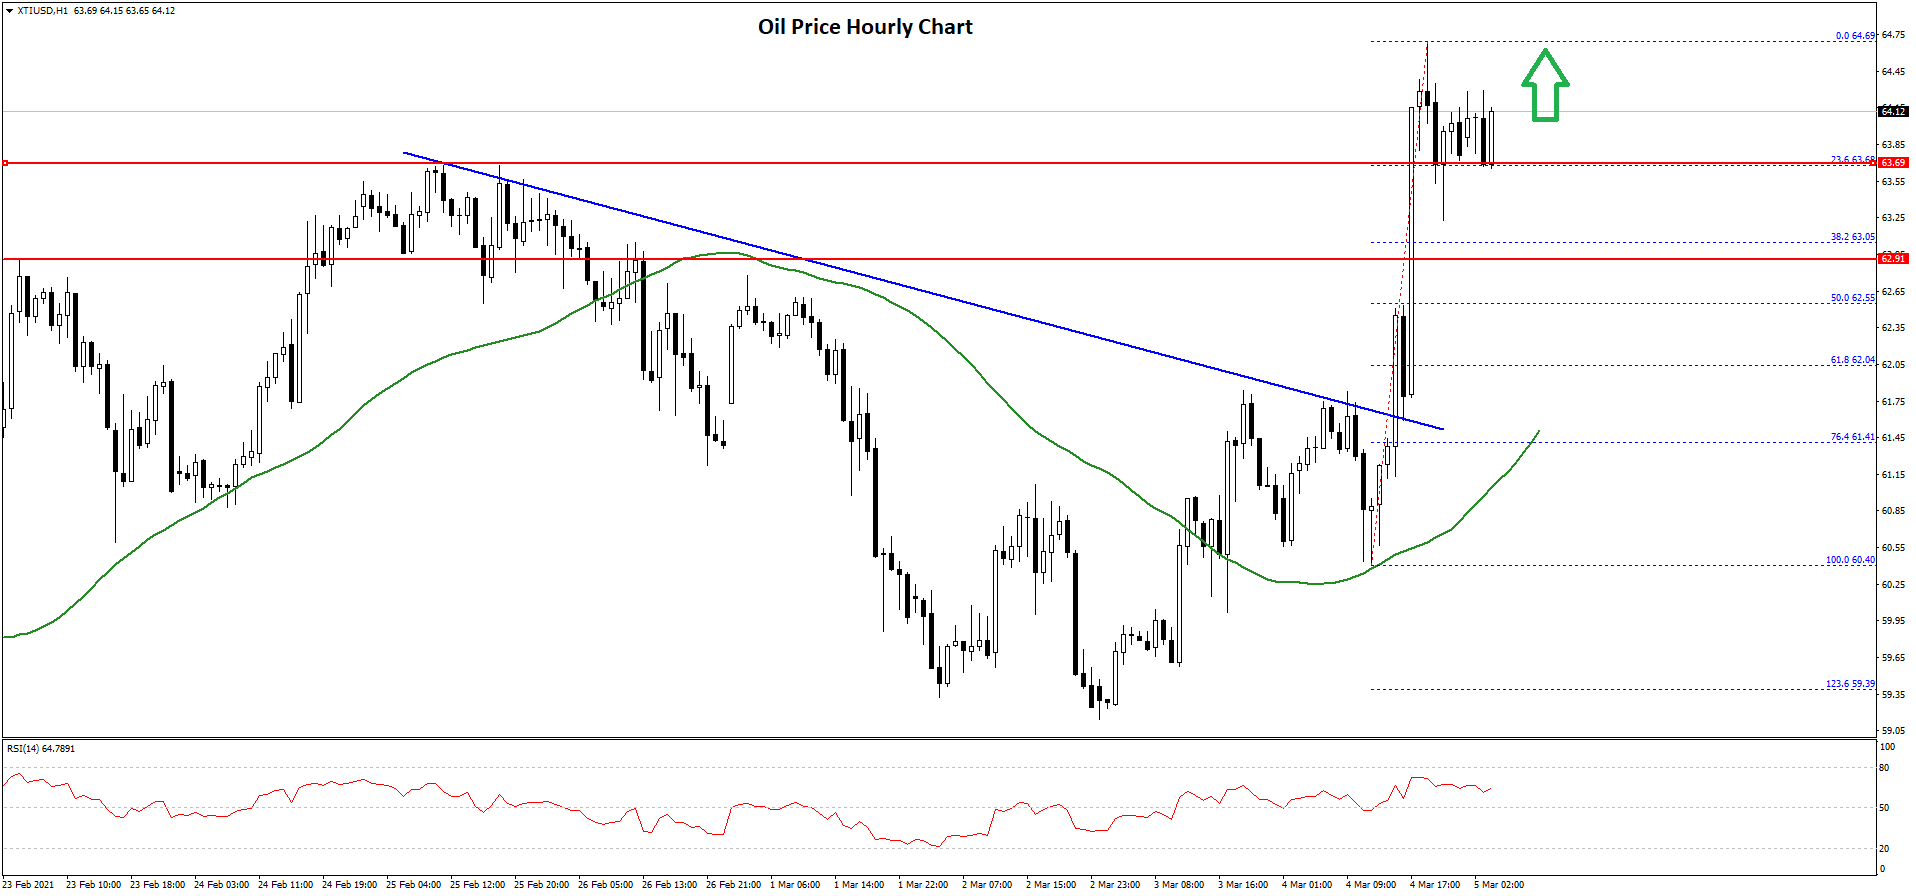
Crude oil price remains in a strong uptrend and it extended its upward move above the $62.00 resistance zone against the US Dollar. The price even cleared the $63.50 resistance level to move further into a positive zone.
During the increase, there was a break above a key bearish trend line with resistance near $61.50 on the hourly chart of XTI/USD. A new multi-month high was formed near $64.69 before the price started a downside correction.
There was a break below the $64.00 support level, but the price remained well above the 50 hourly simple moving average. It tested the 23.6% Fib retracement level of the upward move from the $60.40 low to $64.69 high.
If there are more downsides, the price could slide towards the $63.00 support. The next major support is near the $62.55 level or the 50% Fib retracement level of the upward move from the $60.40 low to $64.69 high.
On the upside, an initial resistance is near the $64.50 level. The main resistance is near the $65.00 level. A successful break above the $65.00 resistance will most likely call for a move towards the $66.50 level. The next major hurdle for the bulls could be $68.00 in the near term.