Gold Price Struggling While Crude Oil Price Is Recovering Nicely
Gold price started a downside correction below the $1,720 support and even declined below $1,700. Conversely, crude oil price is recovering nicely and trading above $20.00 (spot price).
Important Takeaways for Gold and Oil
- Gold price topped near the $1,740 level and corrected below $1,720 against the US Dollar.
- There is a key bearish trend line forming with resistance near $1,712 on the hourly chart of gold.
- Crude oil price is rising steadily and showing positive signs above $18.00.
- There is a major bullish trend line forming with support near $19.70 on the hourly chart of XTI/USD.
Gold Price Technical Analysis
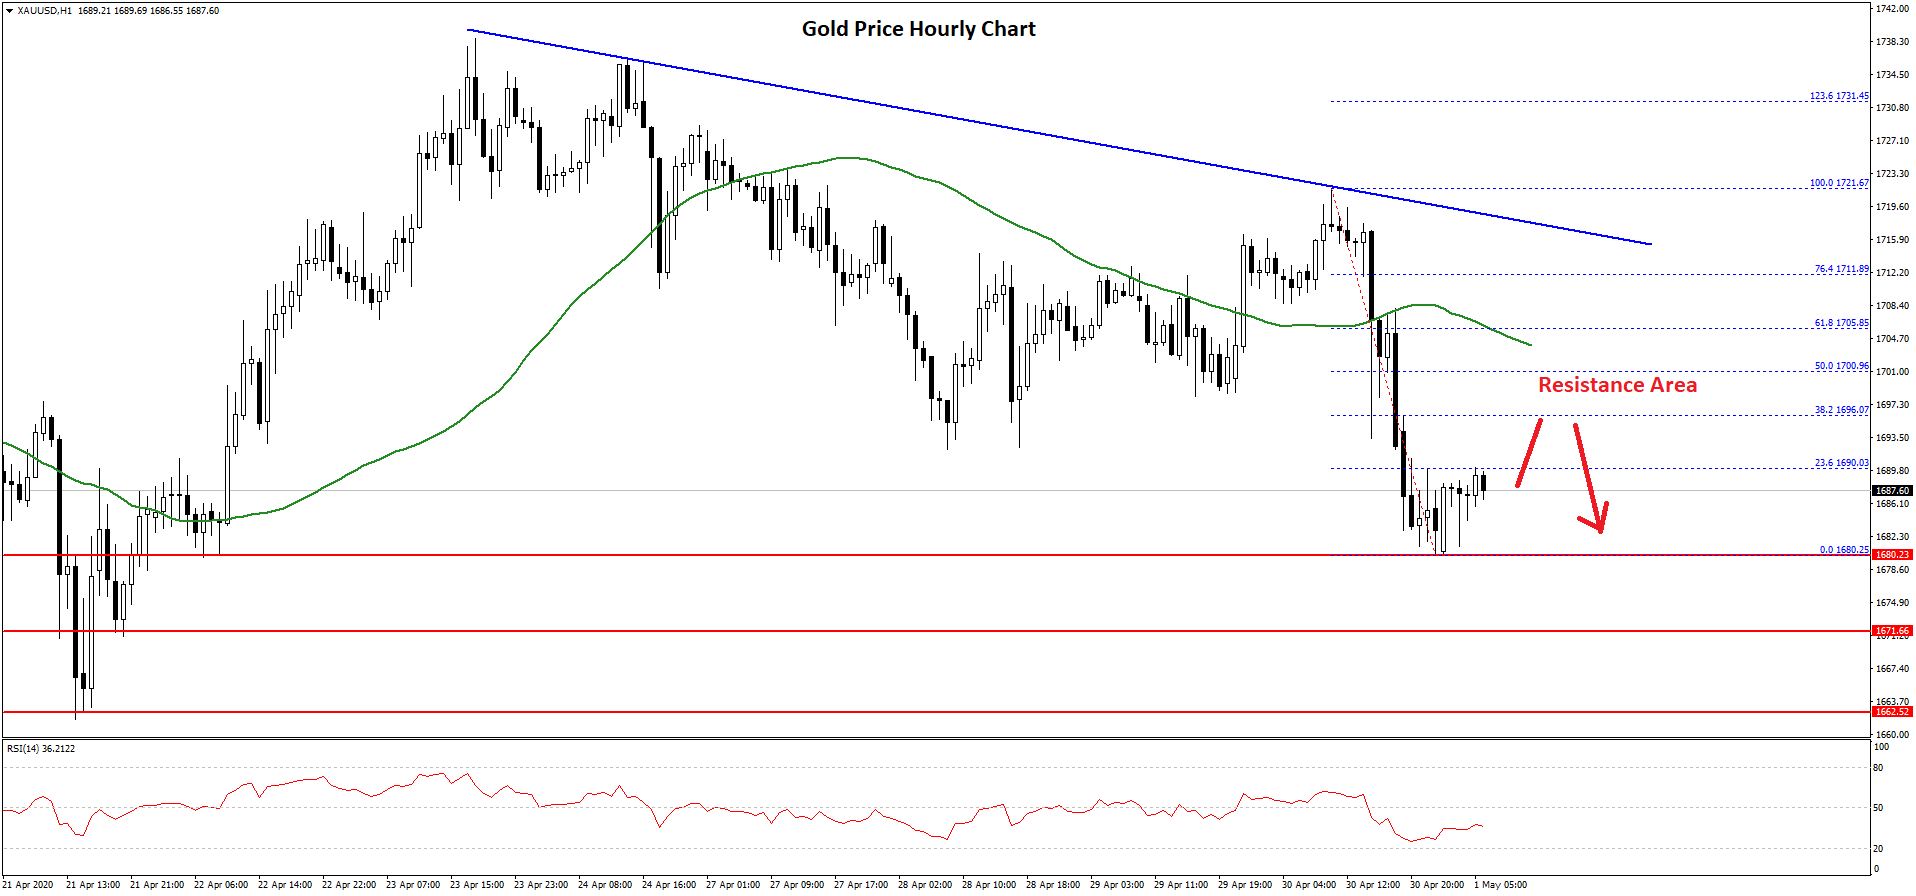
Gold price faced a strong resistance near the $1,740 level and started a fresh decline against the US Dollar. There was a break below the $1,720 support and the price moved into a short term bearish zone.
Besides, there was a break below the $1,700 level and the price settled well below the 50 hourly simple moving average. A low is formed near $1,680 on FXOpen and the price is currently consolidating losses.
An initial resistance is near the $1,690 level. It is close to the 23.6% Fib retracement level of the recent decline from the $1,721 high to $1,680 low.
The first major resistance for the bulls on the upside is near the $1,700 level. It is close to the 50% Fib retracement level of the recent decline from the $1,721 high to $1,680 low.
Moreover, there is a key bearish trend line forming with resistance near $1,712 on the hourly chart of gold. Therefore, the price is likely to face many hurdles if it corrects higher towards the $1,700 and $1,710 levels in the near term.
On the downside, an initial support is near the $1,680 level, below which the price could extend its decline towards the $1,670 support. The next major support is near the $1,662 level.
Oil Price Technical Analysis
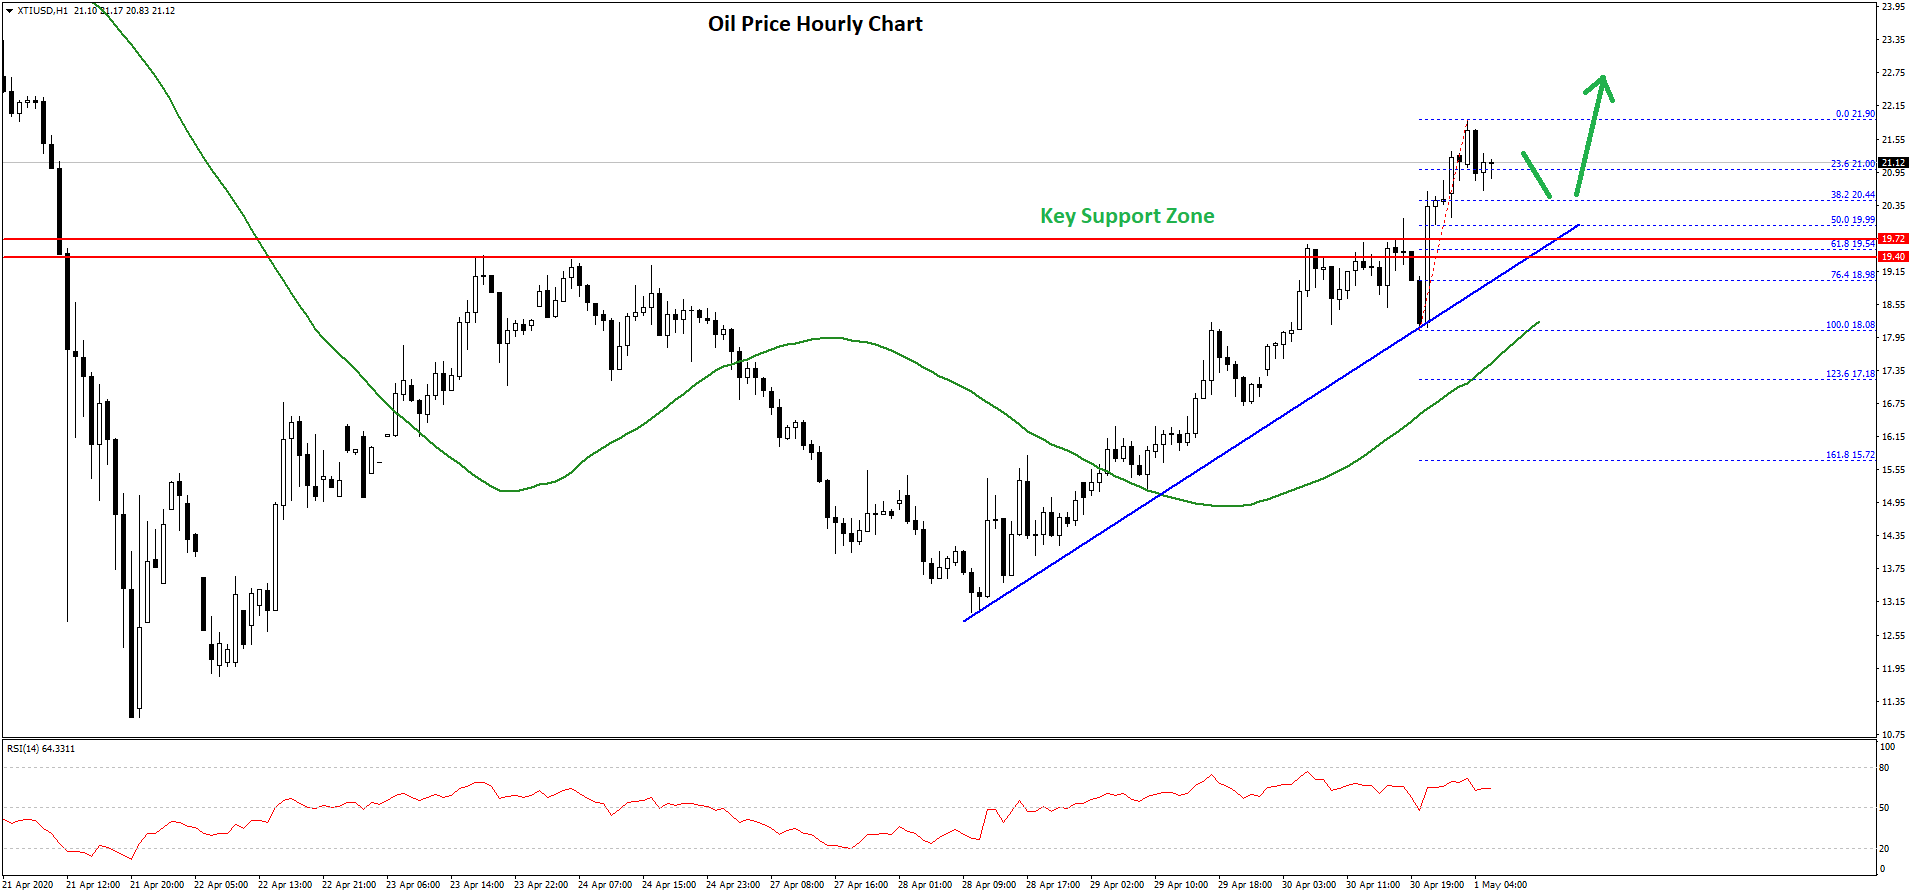
Crude oil price formed a decent support base above $10.00 after a massive decline against the US Dollar. The price started a decent recovery above the $12.00 and $15.00 resistance levels.
Besides, there was a close above the $19.75 resistance area and the 50 hourly simple moving average. It even climbed above $20.50 and traded as high as $21.90.
It is currently consolidating gains and trading near the 23.6% Fib retracement level of the recent rise from the $18.08 low to $21.90 high. The first key support on the downside is seen near the $20.00 level.
The 50% Fib retracement level of the recent rise from the $18.08 low to $21.90 high is also near $20.00. Moreover, there is a major bullish trend line forming with support near $19.70 on the hourly chart of XTI/USD.
The main support is near the $19.75 and $19.60 levels (the recent breakout levels). If the price fails to stay above the $19.60 support, there is a risk of a sharp decline towards the $18.00 support and the 50 hourly simple moving average.
Any further losses may perhaps call for a move towards the $16.50 level. Conversely, oil price might continue to rise above $21.50 and $22.00.
The next major resistance on the upside is near the $23.20 level, above which the bulls are likely to aim a test of the $25.00 resistance zone.