Gold Price Stuck Below $1,750, Oil Price Facing Hurdles
Gold price started consolidating in a range above the $1,720 support. Crude oil price is now trading below $60.00 and $60.50 resistance levels.
Important Takeaways for Gold and Oil
- Gold price is trading in a range above the $1,720 support against the US Dollar.
- There are two connecting bearish trend lines forming with resistance near $1,738 on the hourly chart of gold.
- Crude oil price is holding the key $57.50 and $57.40 support levels.
- There is a major bearish trend line forming with resistance near $59.80 on the hourly chart of XTI/USD.
Gold Price Technical Analysis
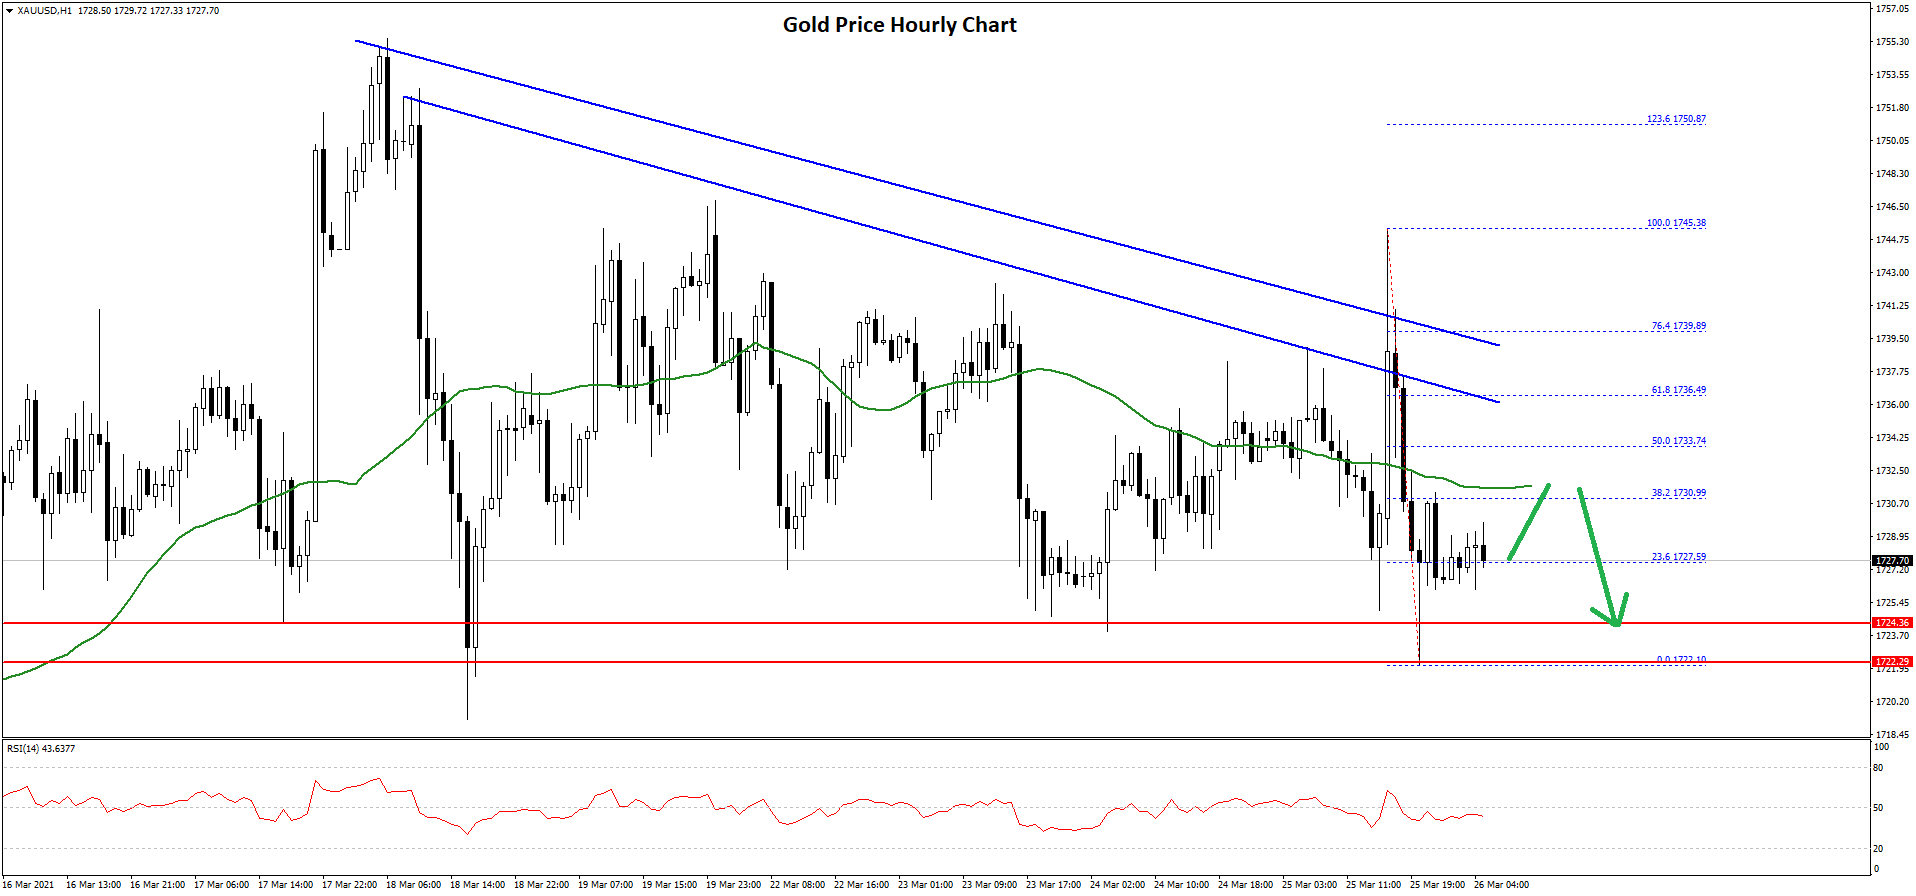
Gold price made an attempt to surpass the $1,750 resistance against the US Dollar, but it failed. As a result, there was a fresh decline, but the bulls were active above the $1,720 support.
It seems like the price is forming a strong support base above the $1,720 zone. The recent low was formed near $1,722 on FXOpen before the price started an upward move. It broke the 23.6% Fib retracement level of the recent decline from the $1,745 swing high to $1,722 low.
An immediate resistance is near the $1,730 level and the 50 hourly simple moving average. The next key resistance is near the $1,733 level. It is close to the 50% Fib retracement level of the recent decline from the $1,745 swing high to $1,722 low.
There are also two connecting bearish trend lines forming with resistance near $1,738 on the hourly chart of gold. To start a strong increase, the price must clear trend lines and $1,740.
The main resistance is still near $1,750, above which the price could start a strong rally. Conversely, the price could fail to continue higher and it might decline below the $1,725 level.
The main support is near the $1,720 zone. A clear break below the $1,720 support may possibly start a strong decline towards $1,700 or even $1,680 in the near term.
Oil Price Technical Analysis
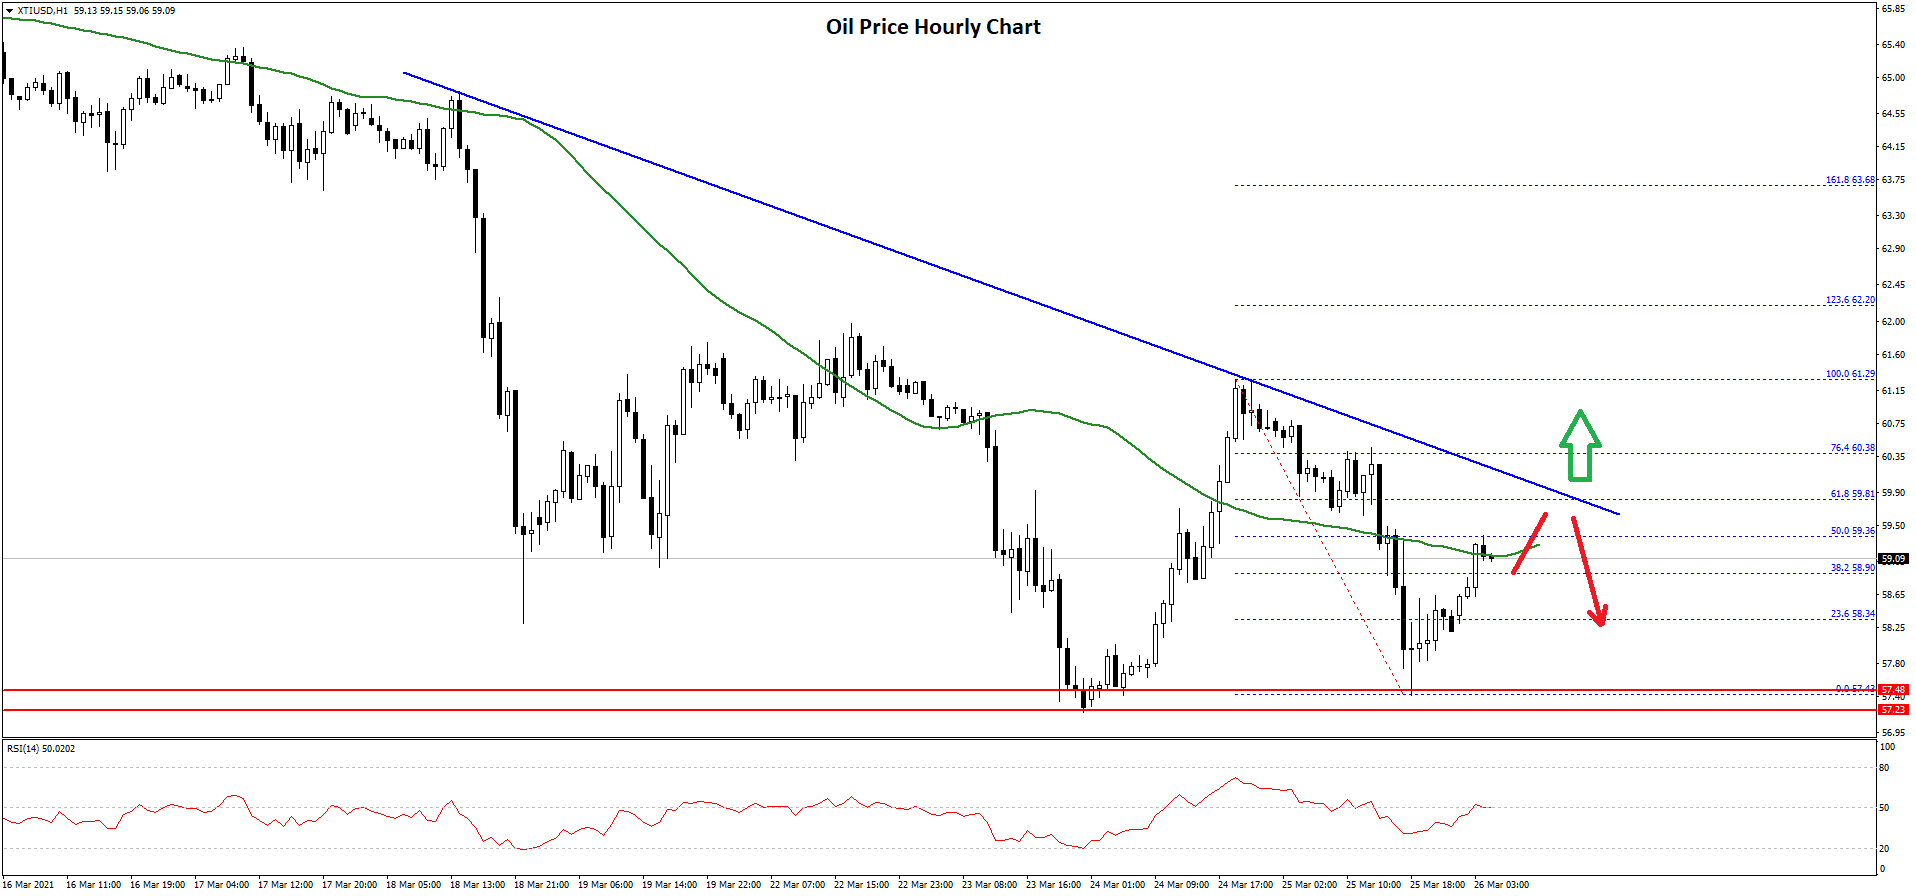
Crude oil price failed to stay above the $63.50 level and started a fresh decline against the US Dollar. The price broke the $62.00 support zone to move into a short-term bearish zone.
The price even broke the $60.50 and $60.00 support levels. The bears pushed the price towards the $57.00 zone. The recent low was formed near $57.42 and the price is currently correcting higher.
There was a break above the $58.00 and $58.20 resistance levels. The price corrected above the 38.2% Fib retracement level of the recent decline from the $61.29 high to $57.42 low. However, the price seems to be facing resistance near $59.30 and the 50 hourly simple moving average.
The 50% Fib retracement level of the recent decline from the $61.29 high to $57.42 low is also near the $59.36 level. There is also a major bearish trend line forming with resistance near $59.80 on the hourly chart of XTI/USD.
If there is an upside break above $59.30 and then $59.80, the price could resume its increase towards $61.50 and $62.00. The next major resistance is near the $63.50 level.
Conversely, the price might fail to recover above $60.00 and it could start a fresh decline. An initial support is near the $58.20 level. The next major support is near the $57.40 level, below which the price might test $55.00.