Gold Price Surging While Crude Oil Price Might Correct Lower
Gold price surged above the $1,620 level and it might continue to rise. Crude oil price is currently correcting lower and it could decline towards the $52.50 support.
Important Takeaways for Gold and Oil
- Gold price gained traction and rallied above $1,610 and $1,620 against the US Dollar.
- There is a key bullish trend line forming with support near $1,615 on the hourly chart of gold.
- Crude oil price tested the $54.50 resistance area and corrected lower.
- There was a break below a connecting bullish trend line with support near $53.80 on the hourly chart of XTI/USD.
Gold Price Technical Analysis
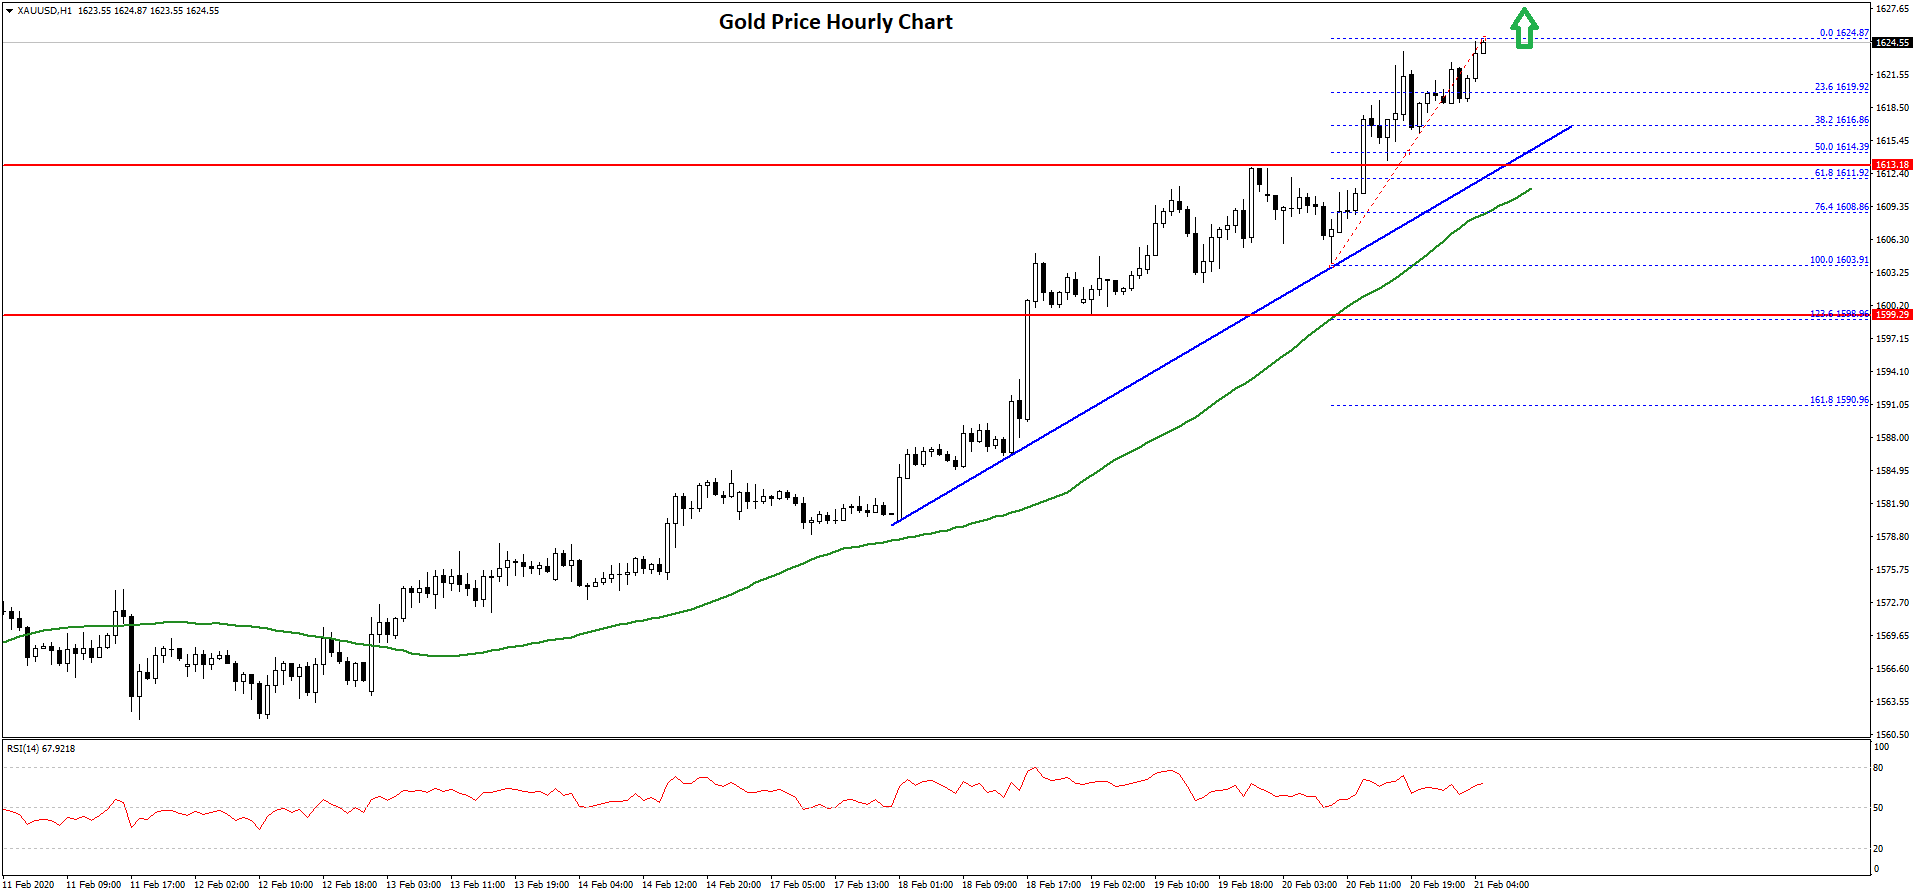
In the past few days, gold price started a strong rise above the $1,580 pivot level against the US Dollar. The bulls gained strength, resulting in a sharp upward move above the $1,600 resistance area.
The upward move was such that the price settled above the $1,610 level and the 50 hourly simple moving average. Finally, it broke the $1,620 resistance and traded to a new 2020 high at $1,624 on FXOpen.
The price is currently trading with a strong bullish bias and it might continue to rise above the $1,625 level. The next key resistance on the upside is near the $1,640 and $1,645 levels.
On the downside, an initial support is near the $1,620 level. Besides, the 23.6% Fib retracement level of the recent rise from the $1,603 low to $1,624 high is also near the $1,620 level.
Moreover, there is a key bullish trend line forming with support near $1,615 on the hourly chart of gold. The trend line is close to the 50% Fib retracement level of the recent rise from the $1,603 low to $1,624 high.
Therefore, dips remain well supported on the downside near the $1,620 and $1,615 levels. The main support on the downside is now near the $1,610 level since it coincides with the 50 hourly simple moving average.
Oil Price Technical Analysis
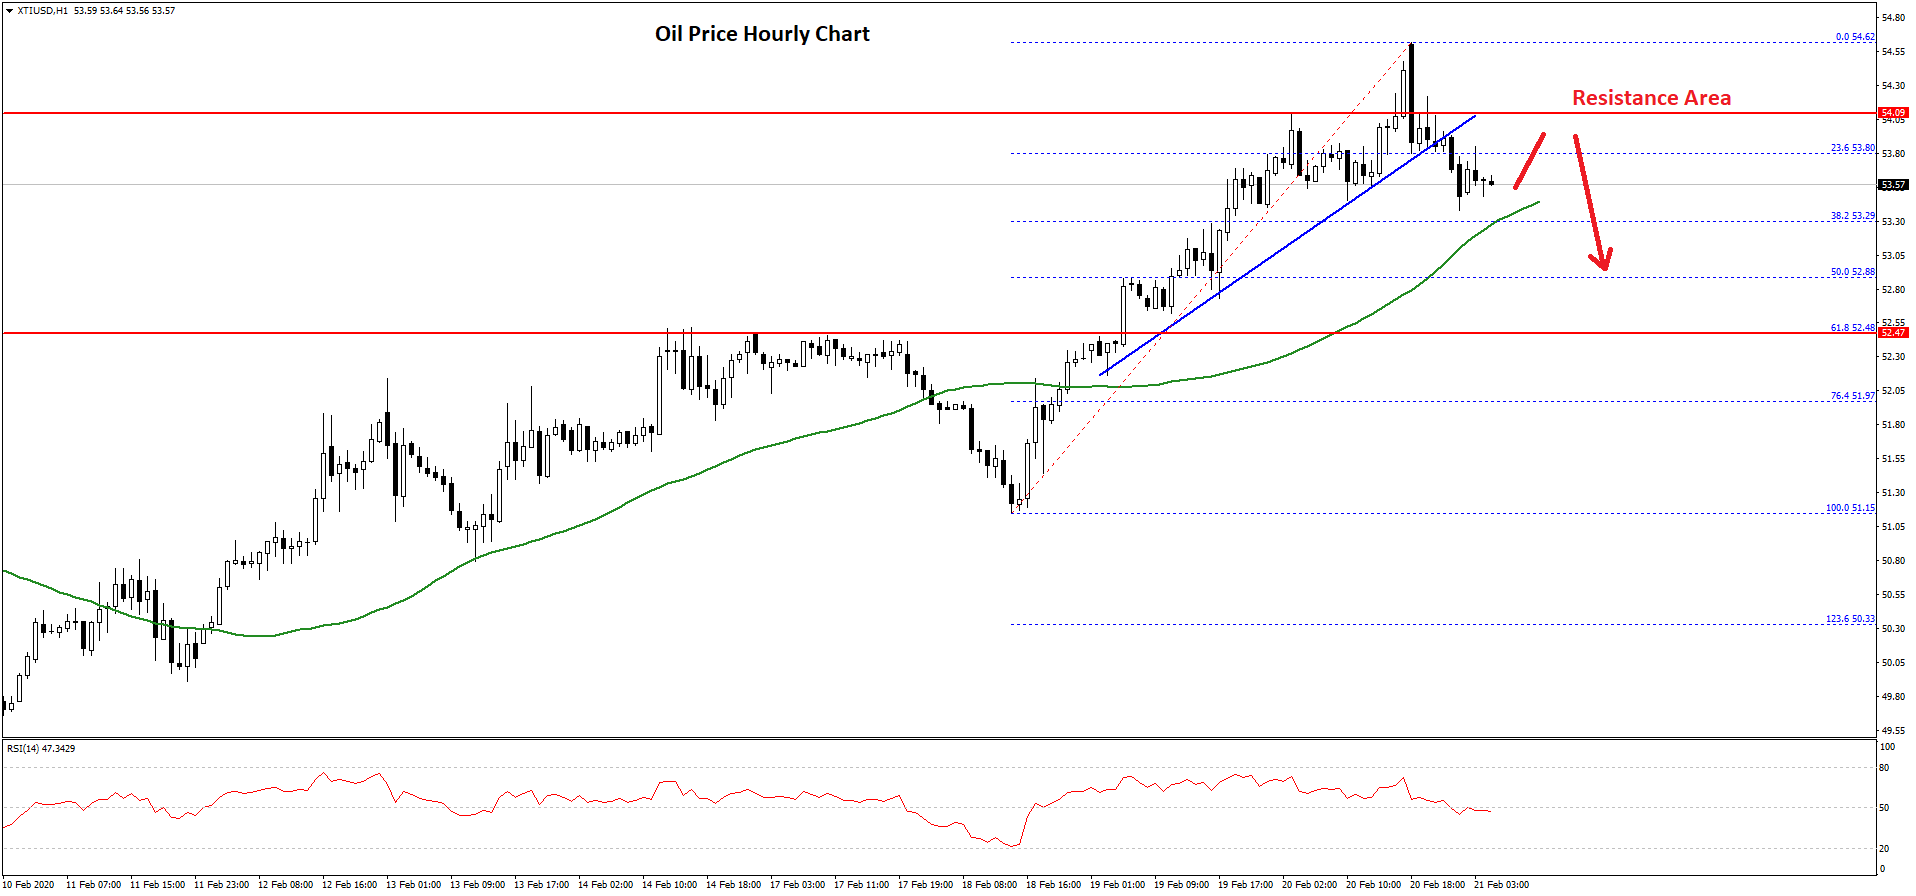
There were also positive moves in crude oil price above the $52.50 and $53.20 levels against the US Dollar. The price even climbed above the $53.50 resistance area.
Finally, it rallied above the $54.00 level and settled above the 50 hourly simple moving average. The price traded as high as $54.62 and recently started a downside correction.
It traded below the $54.40 and $54.20 support levels. Besides, there was a break below the 23.6% Fib retracement level of the upward move from the $51.15 low to $54.62 high.
Besides, there was a break below a connecting bullish trend line with support near $53.80 on the hourly chart of XTI/USD. The price is now approaching the $53.50 support area and the 50 hourly simple moving average.
The first major support is near the $53.00 level. It is also close to the 50% Fib retracement level of the upward move from the $51.15 low to $54.62 high.
If the price fails to stay above the $53.50 and $53.00 support levels, it could decline sharply towards the $51.20 support level.
Conversely, crude oil price might start a fresh increase above the $54.00 level. However, a successful close above the $54.20 is needed for upside continuation towards the $55.00 level in the near term.