Gold Remains in Uptrend, Oil Could Continue Lower
Gold price is trading nicely above the $1,210 support with a bullish bias. However, crude oil price is trading lower and upsides are likely to be capped near $72.00.
Important Takeaways for Gold and Oil
- Gold price gained traction recently and traded above the $1,224 resistance against the US Dollar.
- There is a short-term bullish flag pattern forming with resistance at $1,222 on the hourly chart of gold.
- Crude oil price declined recently and traded below the $72.00 and $71.20 support levels.
- There is a bearish trend line in place with resistance at $71.40 on the hourly chart of XTI/USD.
Gold Price Technical Analysis
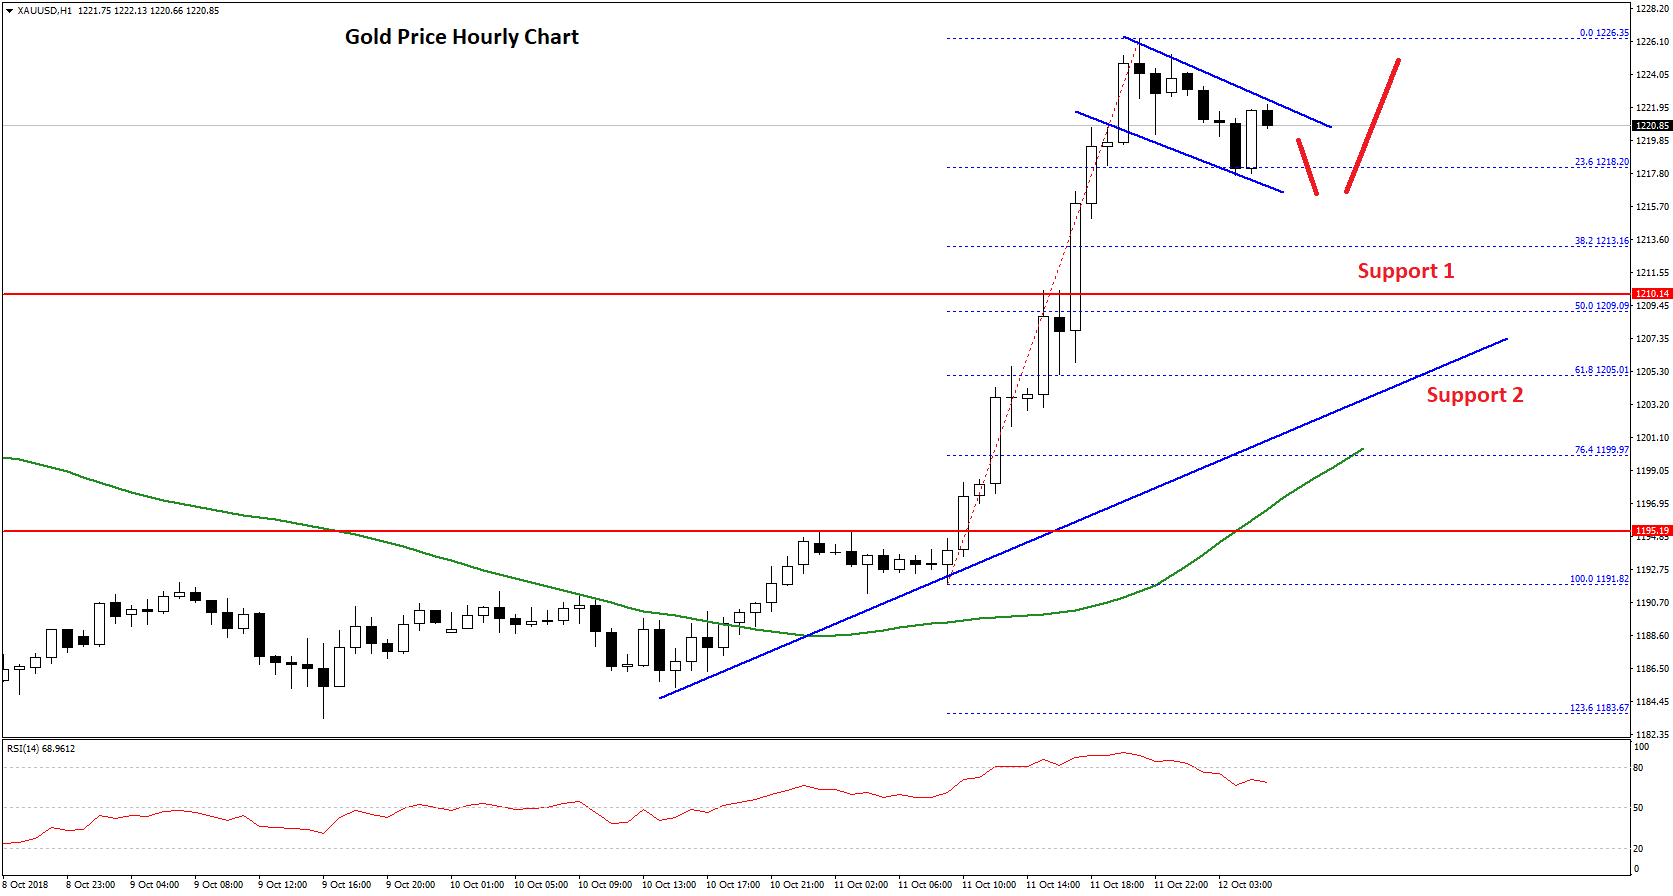
Gold price started a nice upside move after forming a base near the $1,184-1,185 zone against the US Dollar. The price traded higher and broke the $1,200, $1,205 and $1,220 resistance levels.
The upside move was strong as the price even traded above the $1,224 resistance and settled above the 50 hourly simple moving average. The price formed a high at $1,226 and later started consolidating in a range.
At the moment, it seems like there is a short-term bullish flag pattern forming with resistance at $1,222 on the hourly chart of gold. The price recently tested the 23.6% Fib retracement level of the last wave from the $1,191 low to $1,226 high.
In the short term, there could be a couple of swing moves below $1,225, but the overall price action is positive. On the upside, a break above the $1,225 and $1,226 resistance levels could open the doors for more gains towards the $1,230 level.
On the downside, below $1,218, the next major support is near the $1,210 level. It also coincides with the 50% Fib retracement level of the last wave from the $1,191 low to $1,226 high.
Overall, the price remains well positioned for more gains as long as the price is above the $1,210 support area.
Oil Price Technical Analysis
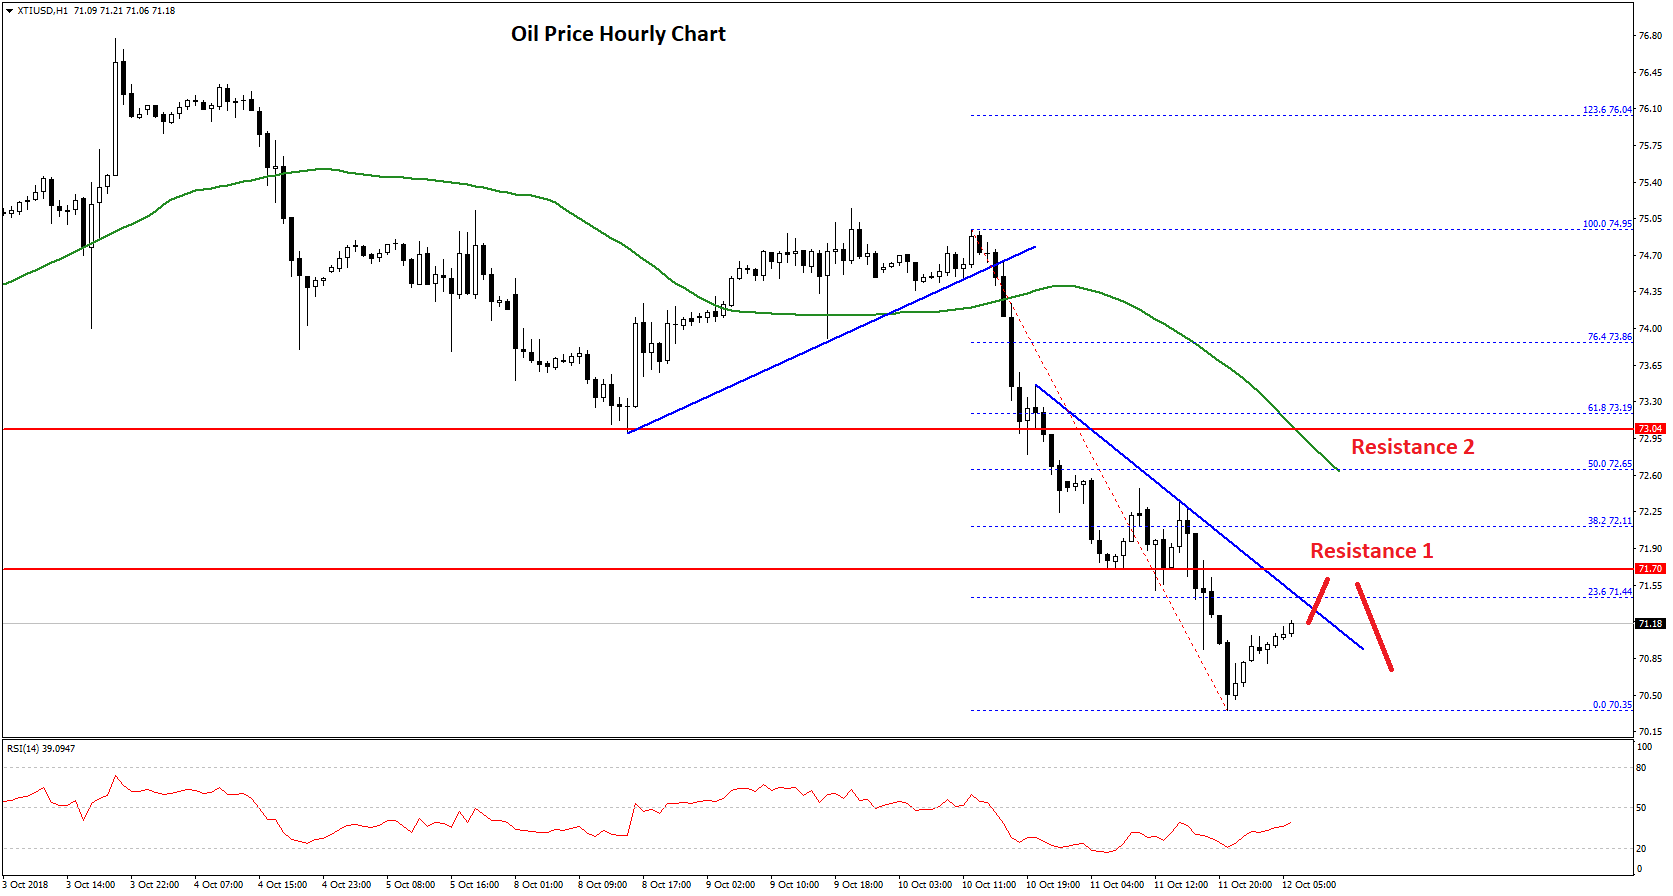
Crude oil price formed a major top near the $77.00-78.00 zone against the US Dollar. The price started a major downside correction and declined below the $75.00 and $74.20 support levels.
The downside move was strong as the price broke the $72.00 support and settled below the 50 hourly simple moving average. The decline was such that the price traded close to the $70.00 level.
A low was formed at $70.35 and the price is currently correcting higher. An initial resistance is close to the 23.6% Fib retracement level of the recent decline from the $74.95 high to $70.35 low.
Moreover, there is a bearish trend line in place with resistance at $71.40 on the hourly chart of XTI/USD. Above the trend line resistance, the price may test the $71.70 resistance. The most important resistance for buyers is near the $72.50 level.
Moreover, the 50% Fib retracement level of the recent decline from the $74.95 high to $70.35 low is also around the $72.50-60 zone. Therefore, if the price continues to correct higher, it could face a lot of selling pressure near the $72.00 and $72.50 levels.
On the downside, the recent low of $70.35 is a short term support, below which the price could break the $70.00 support to move further into the bearish zone.