


How to Predict Market by COT and DB reports?
FXOpen

My previous article received so much feedback that I have decided to go deeper into the subject. I would like to give you a general idea of COT and DB reports. Hopefully, this will encourage you to study numerous materials by other authors and develop your own view.
Commitments of Traders (COT)
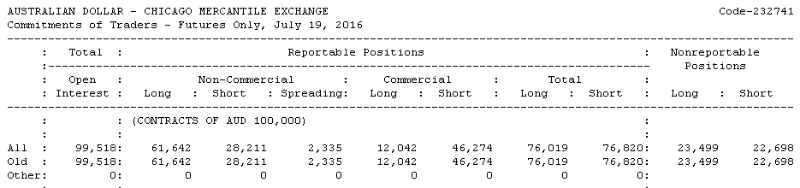
I`ll start with the COT report. Every week the US Commission Commodity Futures Trading (CFTC) publishes data on purchases and sales made during the previous week by three groups of traders: hedgers (or operators), large traders (large speculators) and small traders (small speculators). In the COT report, operators are specified as Commercial Position, large speculators — as Non-Commercial and small speculators — as Nonreportable Position.
For a better understanding of participants in each group related to the currency market, I suggest referring to operators as banks, to large speculators as various funds involved in money management, and to small speculators like you and me.
I will focus on one group of the three: operators. I use their total net position for the analysis:
12,042 Long — Short 46,274 = – 34,232 Net Position
In our example, the operators have a net short position of 34,232 contracts. I compare this result to the historical values over the past three years. When this value approaches historical values, I expect the market to revert in the direction of the open net position of operators and I look for a confirmation on the price chart, but not before this condition is met.
Meaning that if operators have a maximum three-year net short position, I expect the market fall and vice versa. I expect a rally if operators have a maximum net long position over three years.
Idea#1
I am convinced that this group has the greatest influence on the price and, more than others, is aware of the future value of the product. This is confirmed by the historical data.
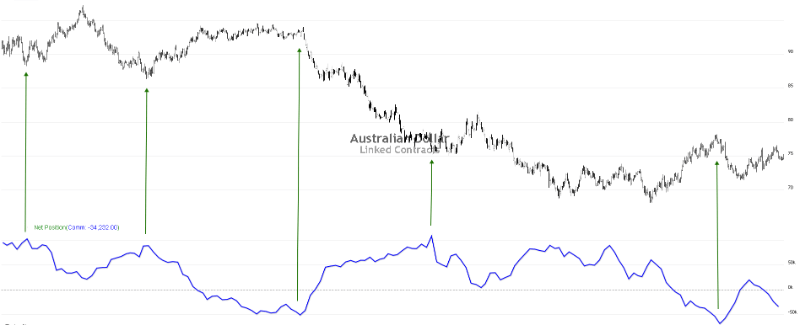
The chart shows the daily price for the futures on the Australian dollar at the top and the net position of operators at the bottom. Here we can see that the market often reverses in the moments when operators have historically maximal net open position. The long position – and the market grows up, the short one – and it falls.
As for the COT report, I would stop here and move on to the next report. However, please keep in mind that this is just the basic idea, and there is still something to think about and to discuss.
Daily Bulletin (DB)
Every day after the market closing the Chicago Mercantile Exchange (CME) generates a separate report for each instrument. If there are no much data, the exchange combines the assets. This report contains a lot of information on futures and options where we can find the data on the volume for the previous day, open interest (open positions) at the end of the day, and so on.
Our main interest in these reports is an open interest on options on futures at the end of the day. It`s time to say a few words about what an option is and what types of options exist. An option is a contract between two parties for the supply of goods at a particular price at any time until a certain date.
For example, we agree that prior to the first day of the following month, if you have such a need, I`ll be obliged to buy 2 million EUR for USD at the exchange rate of 1.09 from you, even if Euro will cost less, say 1.03. For this opportunity, you pay me a premium and if you don`t take it, the premium will still stay with me.
In this example, you want to insure against the reduction of Euro against dollar and you buy a put option, and I sell it. If the rate falls, you will execute your option, and I will get a loss minus the premium that you paid to me when you bought the option. If the rate becomes higher than 1.09, the premium will stay with me, and you won’t need to implement this put option. The image below shows the report on put options during the current option month.
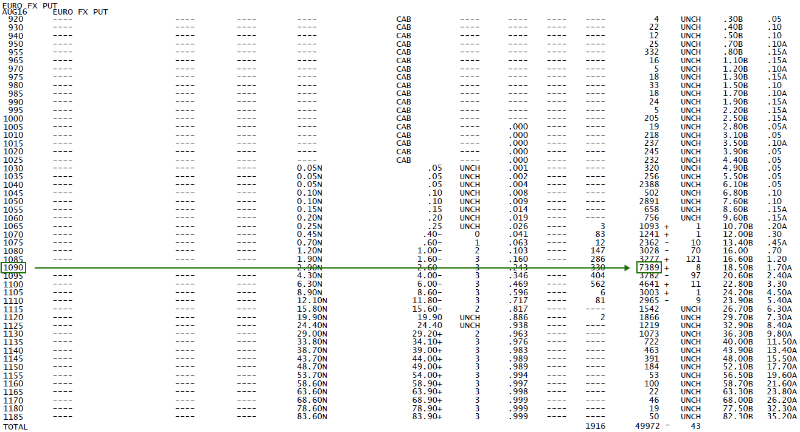
As we can see, there`re many people who want to hedge against Euro falling against dollar — 7,389 contracts, and the 1.09 level arouses the biggest interest among the participants.
We will see the similar tendency on the back of the market with the call options of the people who want to hedge against the increase in the value of Euro.
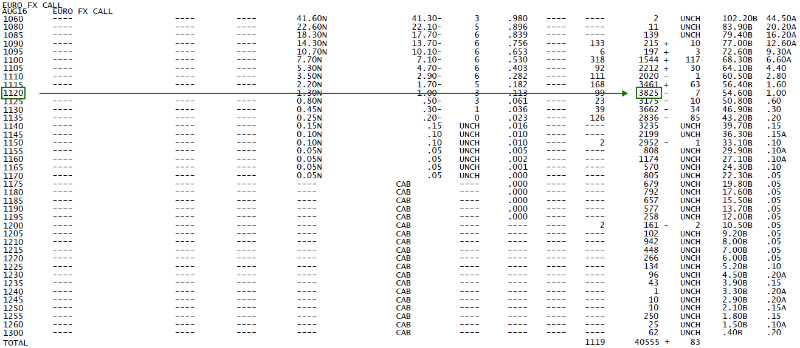
However, in this example we can see that open interest on strikes is not as concentrated as in the first case. Nonetheless, here we also allocate the strike with the greatest interest. In our case, it is 1.12 with 3,825 contracts.
Thus, we can see two levels, one of which is located below the current price, and the second one – above it: 1.09 and 1.12 respectively. If during this option month the price rises above 1.12, we will look for sales, if it drops below 1.09 — we`ll look for purchases, but not before this condition is met.
Idea#2
Here I am convinced that the group of participants selling options for everyone who wants to hedge against rising or falling prices would not do that if they were not sure that by the end of the option month the price wouldn`t float the price corridor between 1.09 and 1.12. Only in this case the sellers of the options will be able to retain the received premiums for both the put and call options.
Unfortunately, I don`t have a beautiful picture with historical data confirming my words, as in the first example. You`ll have to take my word for it or to investigate the matter.
For sure, everything is not that simple and definite as it may seem at first glance, and I would ask you not to be blinded by the ideas that I have outlined here. Be critical and shape your own belief system.
Source – Sergey Shirko`s blog in LinkedIn
This article represents the opinion of the Companies operating under the FXOpen brand only. It is not to be construed as an offer, solicitation, or recommendation with respect to products and services provided by the Companies operating under the FXOpen brand, nor is it to be considered financial advice.
Stay ahead of the market!
Subscribe now to our mailing list and receive the latest market news and insights delivered directly to your inbox.

Latest articles

DAX 40: consolidation amid technology sell-off
A wave of selling in the technology sector that emerged earlier this week has weighed on European equities. The trigger was investor concern over the profitability of large-scale debt-funded investments by major US tech companies in AI infrastructure. The Nasdaq

Euro Hits Fresh Yearly Lows Amid Dovish ECB Signals
The euro remains under pressure following weak macroeconomic data from the euro area and fresh signals that the European Central Bank is prepared to maintain a more accommodative monetary policy stance. Data released yesterday pointed to a deterioration in business

Pound at Key Levels: Markets Assess Impact of Political Uncertainty in the UK
The British pound remains under pressure following increased political uncertainty in the United Kingdom triggered by the Prime Minister’s resignation. Investors are assessing potential shifts in the political and economic policy outlook after the head of government stepped down,