


FXOpen
When it comes to forex, commodity, and stock patterns, the morning doji star is among the most well-known. It stands out as a signal that bearish momentum may be weakening and buyers could be stepping in. Formed of three candles, it often appears near the end of a downtrend and can mark the start of a potential recovery. This article explains how it works and how traders may apply it.
What Is a Morning Doji Star?
The morning doji star is a reversal candlestick pattern.The formation indicates a shift in market sentiment, with buyers gaining control. It consists of three candles and is considered an alert of a potential trend reversal from bearish to bullish.
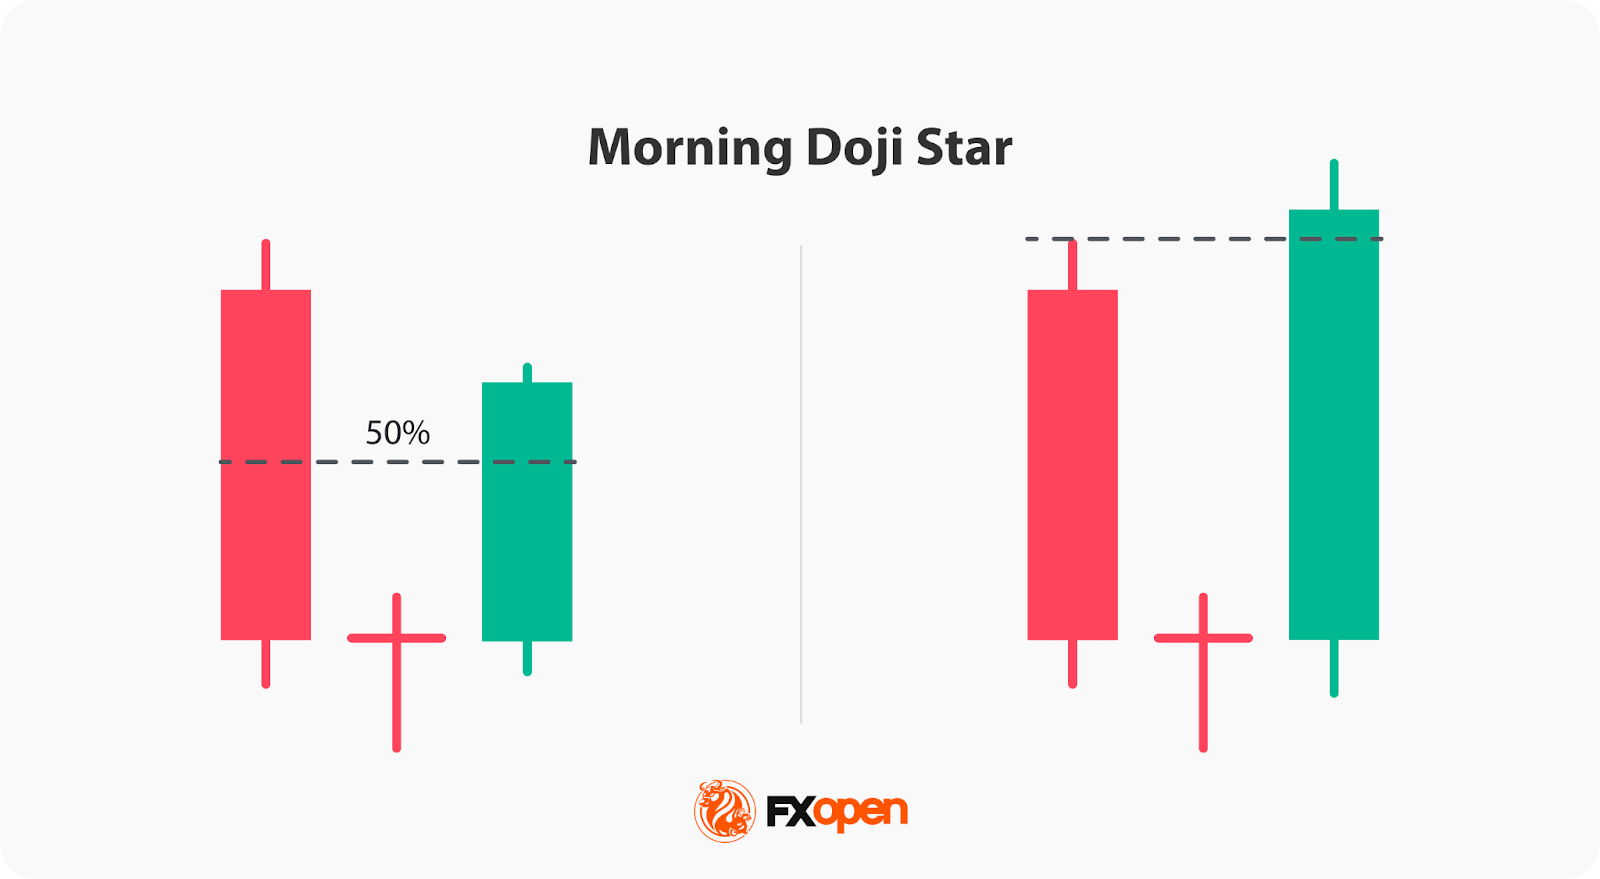
To identify the morning doji star chart pattern, traders look for the following characteristics:
- The first candle is bearish, typically with a long body, indicating a downtrend.
- The second candle is a doji, characterised by a small body with long upper and lower shadows, suggesting indecision in the market.
- The third candle is bullish, usually with a long body, reflecting that bulls are gaining strength. The body of the third candlestick should close above the midpoint of the first bearish one.
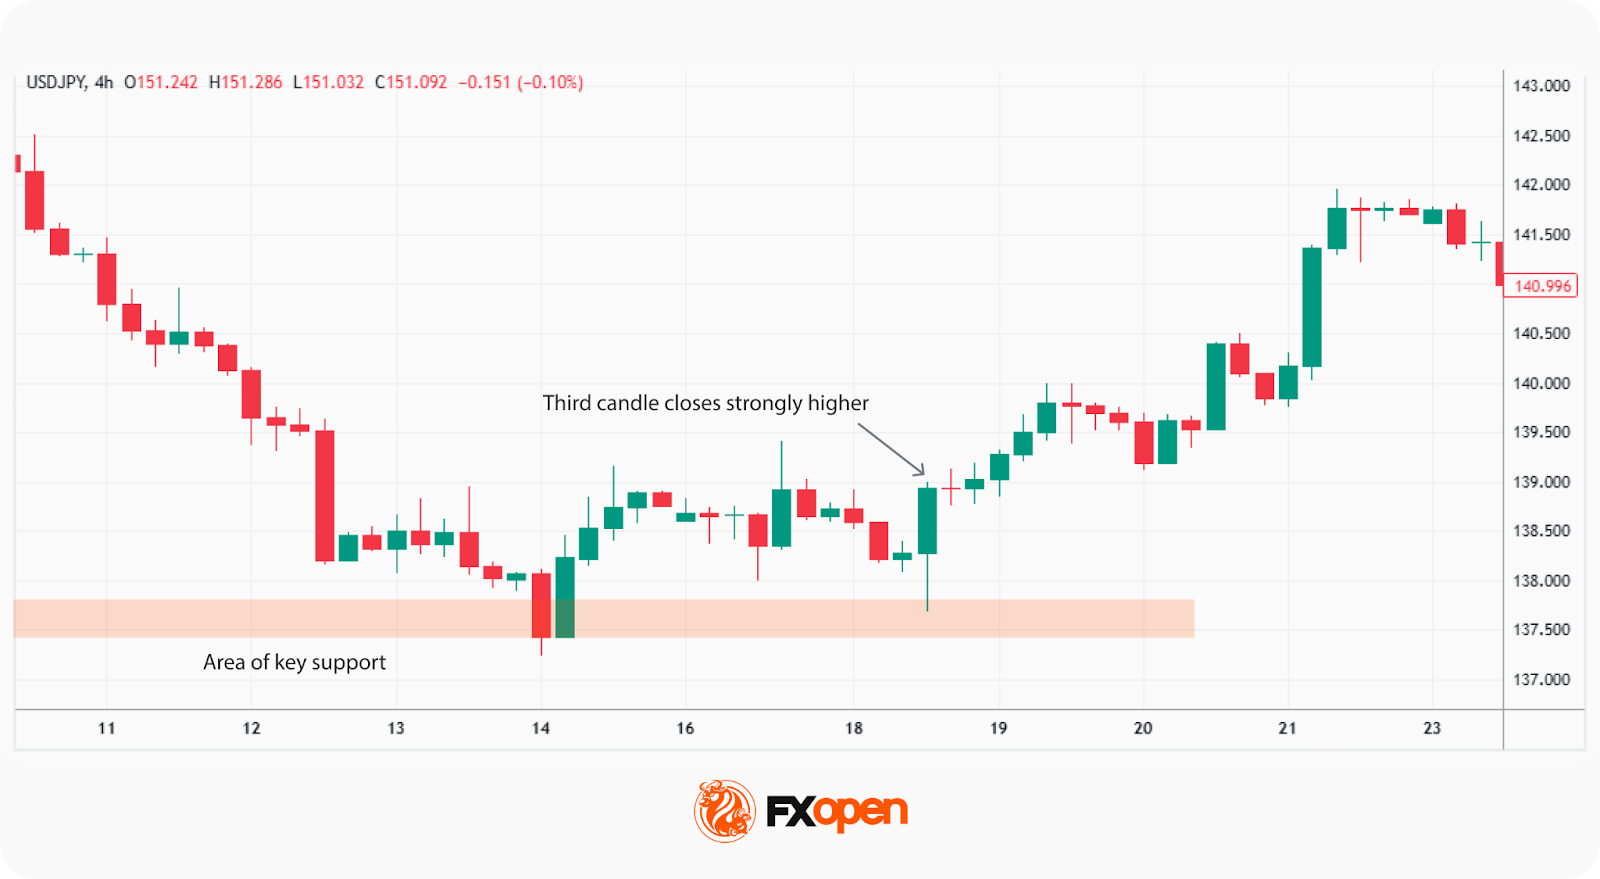
This pattern most often forms near significant support levels or after extended downtrends, where sellers have pushed prices to exhaustion.
You can head over to FXOpen’s TickTrader platform to identify the morning doji star pattern in real-time markets.
The Psychology Behind the Pattern
The bullish morning doji star captures a clear shift in market sentiment. The first candle represents a period where sellers dominate, driving prices lower and reinforcing bearish confidence. The second candle, the doji, signals a pause—buyers start matching sell orders, and uncertainty replaces conviction. This hesitation often marks the point where selling pressure begins to dry up. By the third candle, buyers step in decisively, pushing prices higher and forcing short traders to cover their positions.
This bullish doji morning star reflects the tug-of-war between exhaustion and renewed optimism. It forms when market participants collectively reassess value after extended declines. The strong bullish close confirms that control has shifted. Understanding this behavioural dynamic is important—what’s really changing isn’t just price direction but sentiment itself, as traders transition from fear and capitulation to cautious accumulation and renewed confidence.
Technical Context and Market Conditions
The morning doji star pattern may carry more weight when it appears in the right context. On its own, it shows a shift in momentum, but within a broader technical setup, it can highlight meaningful turning points. Here’s what traders often look for when assessing its reliability:
1. Clear Downtrend Before Formation
The pattern needs context—a genuine preceding downtrend. Without it, a morning doji star loses significance. It’s believed to be relevant when prices have been falling steadily, especially after multiple bearish candles or extended weakness.
2. Support Levels
If the pattern forms near a major horizontal support or a trendline that’s been tested before, it may indicate strong buying interest. These areas attract attention because institutional traders often place buy orders there.
3. Rising Volume
Volume typically adds conviction. When the third bullish candle forms with higher-than-average volume, it confirms that genuine buying activity is entering the market rather than a temporary pause in selling.
4. Confluence with Indicators
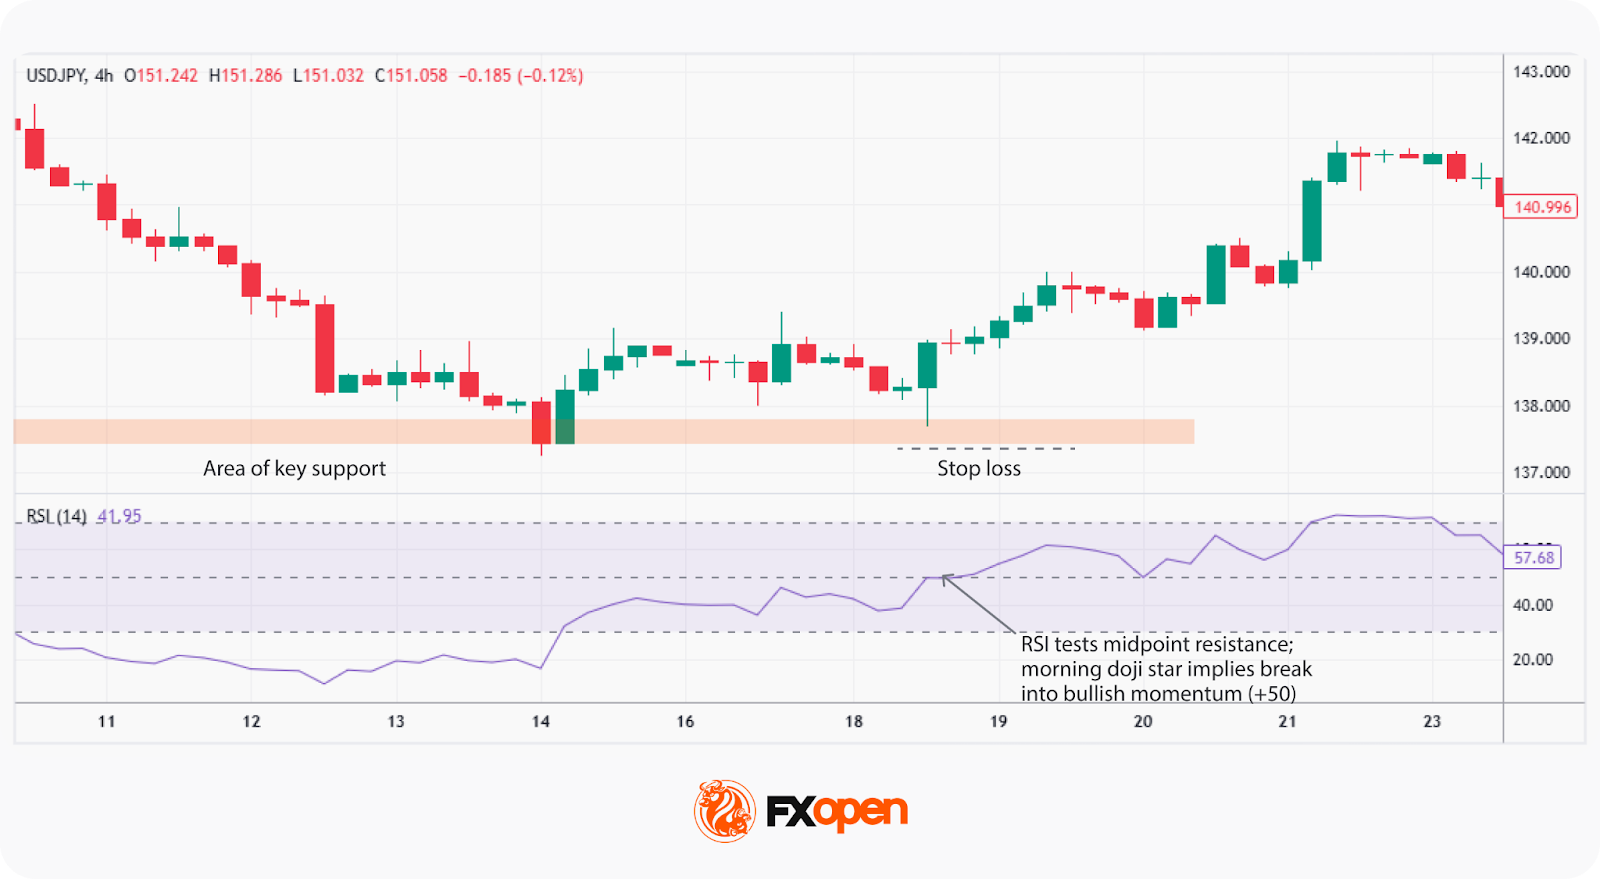
Traders often use RSI, MACD, or moving averages to gauge whether momentum aligns with the reversal. For example, an oversold RSI or a MACD bullish crossover can strengthen the interpretation.
5. Broader Market Conditions
The signal may be stronger during periods of moderate volatility rather than sharp macro shocks.
Combining these factors may help separate strong reversal setups from random noise.
How May Traders Apply the Morning Doji Star Pattern?
The morning doji star candlestick pattern is used to spot potential reversals and assess when bearish momentum may be fading. However, traders don’t treat it as a standalone trigger but as part of a structured market analysis process. Let’s look at how it’s commonly applied:
1. Assessing Market Context
Traders first look at where the pattern forms. A morning doji star near a long-term support zone or after a strong downtrend carries more relevance than one appearing mid-range in consolidation. Confluence with other forms of support, such as moving averages, Fibonacci levels, or trendlines, often adds credibility.
2. Evaluating Candle Structure
The relationship between the candles matters. The third bullish candle ideally closes above the midpoint—or even higher—of the first bearish candle. This shows a decisive shift in sentiment rather than a weak bounce. A noticeable increase in volume reinforces the move.
3. Confirming with Broader Signals
Confirmation often comes from the next few candles continuing higher or from supportive signals on momentum indicators, like the RSI or MACD. Traders also look at higher timeframes to see if the pattern aligns with a wider trend reversal.
4. Monitoring Follow-Through
A valid morning doji star tends to show follow-through strength, with prices holding above the doji’s low and pushing higher in subsequent sessions. If price quickly reverses, it suggests the pattern was a false signal.
Limitations of the Morning Doji Star Candlestick
While the morning doji star can be a useful signal of shifting sentiment, it’s far from foolproof. Traders who rely on it in isolation often misinterpret short-term noise as genuine reversals. Some of the main limitations to keep in mind are:
- False Signals in Sideways Markets: The pattern can appear frequently during consolidation phases, where price movements are erratic and lack clear direction. In these cases, it often fails to mark a true reversal.
- Dependence on Confirmation: Without a strong follow-through candle or increased volume, the pattern may reflect temporary indecision rather than a lasting change in control.
- Limited Value in High Volatility: When markets move sharply due to news or data releases, the structure of a morning doji star can form accidentally, offering unreliable clues about trend strength.
- Lower Timeframes Are Noisy: On intraday charts, random fluctuations can mimic the pattern, reducing its reliability compared to daily or higher timeframes.
- No Insight Into Magnitude: Even when valid, the pattern doesn’t indicate how far or how long a reversal may extend. It signals a possible change in direction—not the size of the move that follows.
Morning Doji Star vs Other Candlestick Patterns
The morning doji star resembles and sometimes is confused with other formations that provide other signals or differ in terms of signal strength. Therefore, traders learn to distinguish between them.
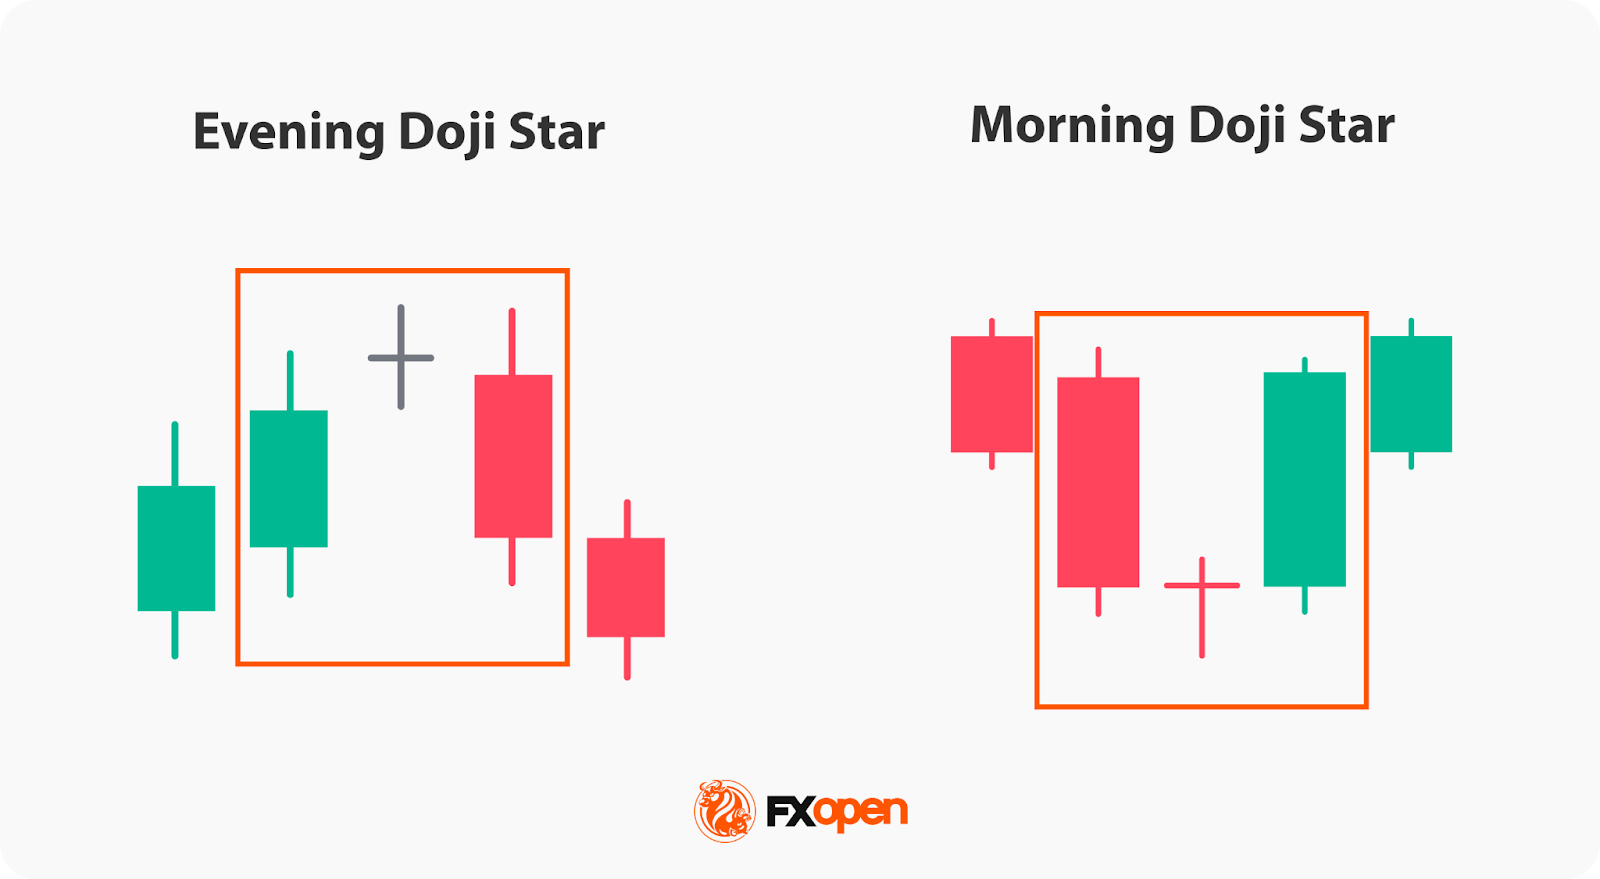
Morning Doji Star vs Evening Doji Star
While the morning doji star in bearish markets is a bullish reversal formation, the evening doji star reflects a potential bearish reversal. The former consists of a long bearish candle, followed by a small-bodied doji, indicating indecision, and a long bullish candlestick. In contrast, the latter is the opposite, with a long bullish candle, a small-bodied doji, and a long bearish candle.
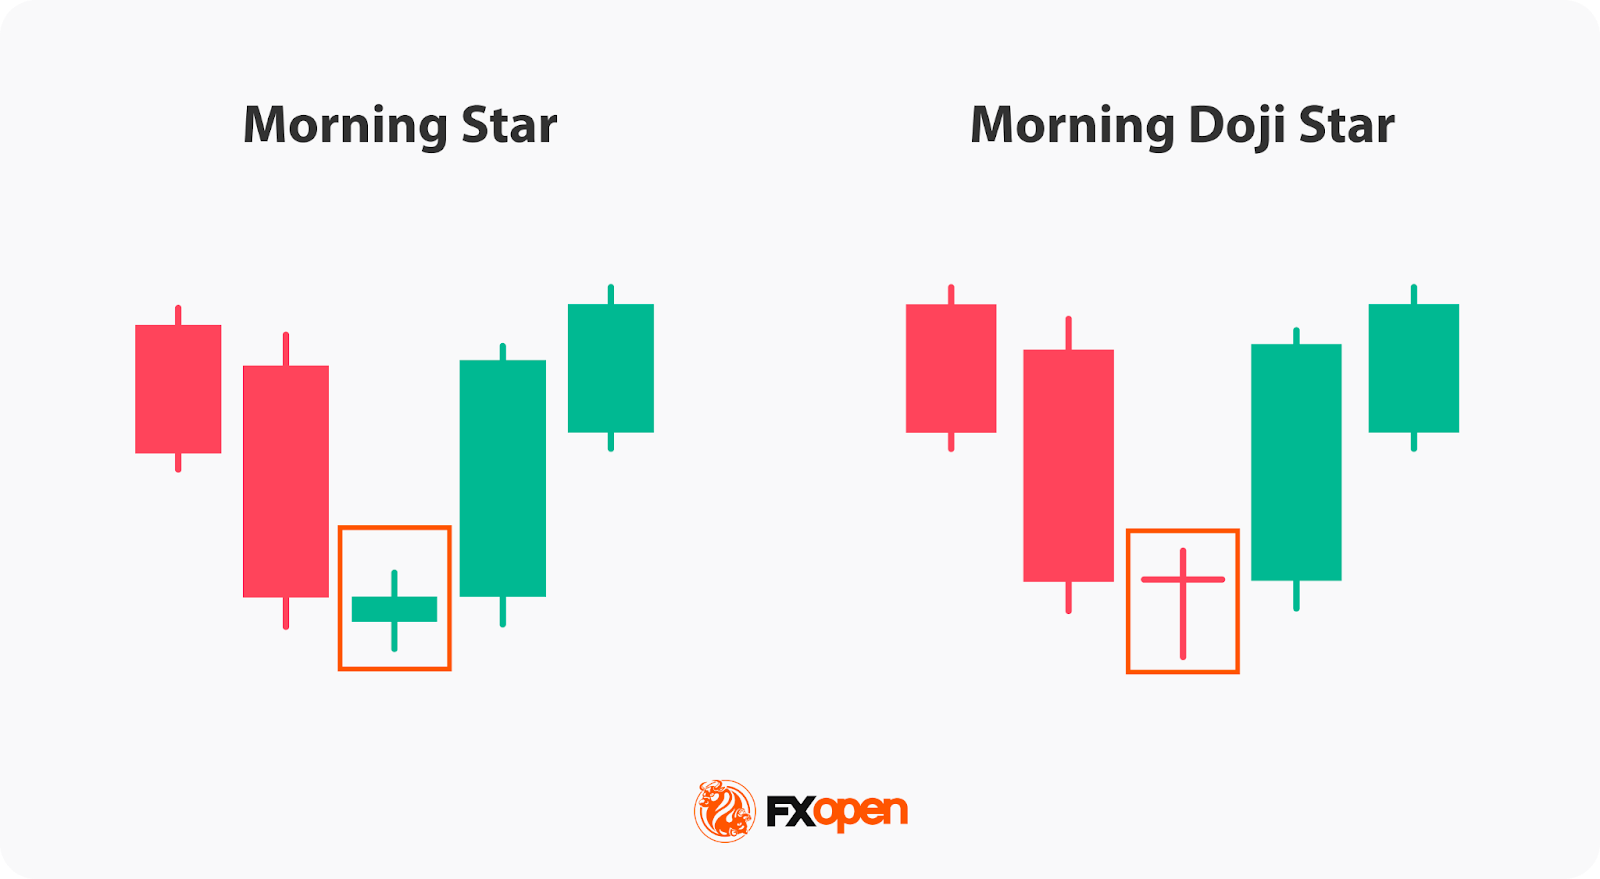
Morning Doji Star vs Morning Star
As mentioned above, the morning doji star is a bullish reversal pattern characterised by a bearish candle, a doji, and a bullish candlestick. On the other hand, the morning star is a broader bullish reversal setup consisting of a bearish candle, a small-bodied one, and a large bullish one. It does not specifically include a doji. The former provides a short-term alert, while the latter gives a longer-term signal.
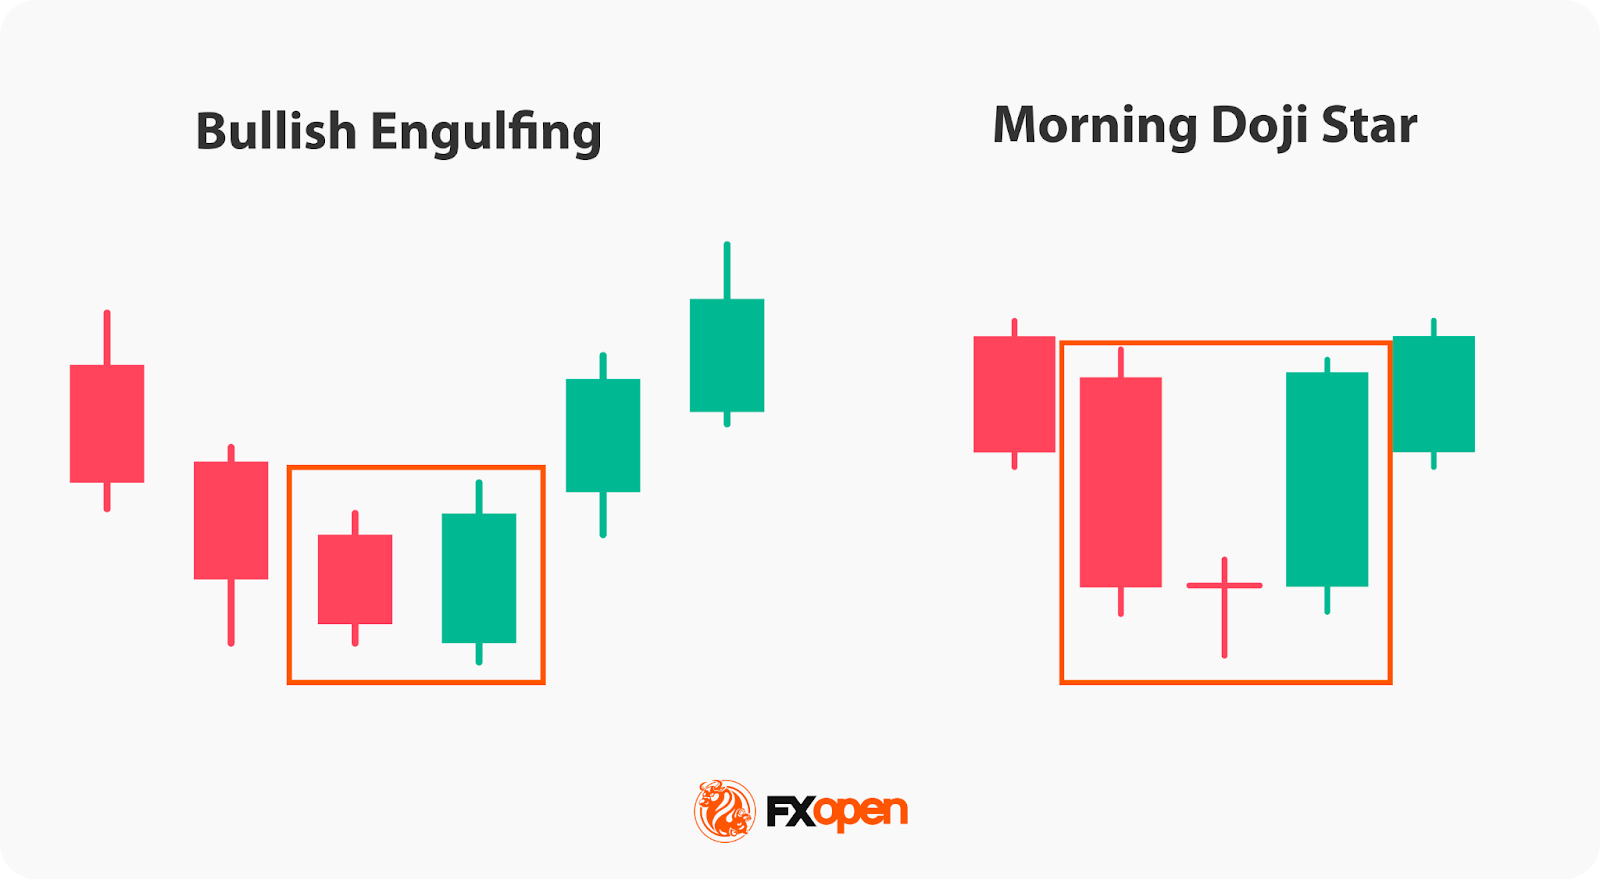
Morning Doji Star vs Bullish Engulfing Pattern
The bullish engulfing pattern is also a reversal signal, but it involves only two candles—the second completely engulfs the first. It often suggests a stronger and faster sentiment shift. In contrast, the morning star doji candle reflects a more gradual transition, showing hesitation before buyers regain control.
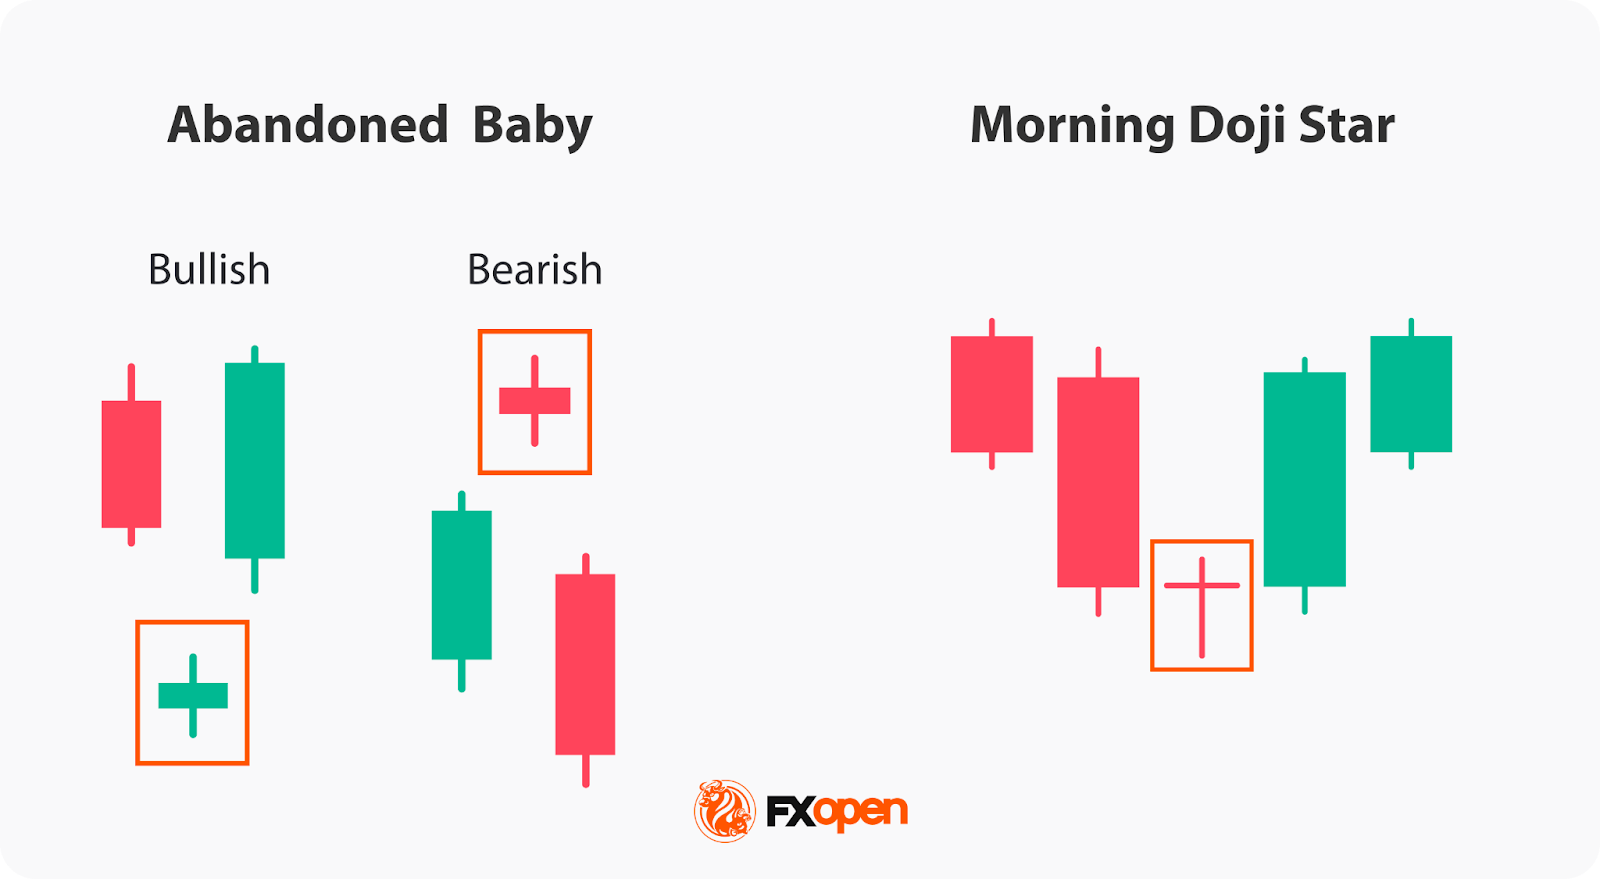
Morning Doji Star vs Abandoned Baby
What is the difference between a morning doji star and an abandoned baby? Both are reversal patterns, but an abandoned baby features a gap between candles—price doesn’t overlap between the doji and its neighbours—making it rarer and often considered a stronger reversal signal than a morning doji star.
The Bottom Line
The morning doji star highlights a possible turning point where sellers lose control and buyers regain confidence. While it’s rare to solely rely on a morning doji star pattern in a strategy, it can add valuable context when combined with broader technical and fundamental analysis.
To study patterns like this in live markets and build your trading approach, you can consider opening an FXOpen account and analysing real price action across multiple instruments and timeframes.
FAQ
What Is the Morning Star With Doji?
The morning doji star candlestick pattern meaning refers to a three-candle reversal pattern that forms after a downtrend. It begins with a large bearish candle, followed by a doji that signals indecision, and ends with a strong bullish candle that closes above the midpoint of the first. This combination shows sellers losing control as buyers start to step in.
Is Morning Doji Star Bullish or Bearish?
The morning doji star is a bullish reversal pattern. It signals that bearish momentum is fading and buying pressure is emerging. Traders view it as an early sign of potential recovery after a decline. A bearish morning doji star is known as an evening doji star.
How May Traders Apply a Morning Doji Star Pattern?
Traders often analyse it alongside volume, support zones, and indicators like RSI or MACD to confirm whether buying strength is real. It’s rarely used alone but as part of a wider technical framework.
This article represents the opinion of the Companies operating under the FXOpen brand only. It is not to be construed as an offer, solicitation, or recommendation with respect to products and services provided by the Companies operating under the FXOpen brand, nor is it to be considered financial advice.
Stay ahead of the market!
Subscribe now to our mailing list and receive the latest market news and insights delivered directly to your inbox.


Latest articles


Market Insights with Gary Thomson: Oil, US Retail Sales & NFP in Focus
In this video, we’ll explore the key economic events and market trends, shaping the financial landscape. Get ready for insights into financial markets to help you navigate the week ahead. Let’s dive in!
In this episode of Market

Geopolitics Fuels Volatility: AUD/USD and USD/CAD Near Key Levels
Commodity-linked currencies continue to weaken amid rising geopolitical tensions, which are boosting demand for safe-haven assets and increasing volatility across both FX and commodity markets. The US dollar is gaining support from demand for liquid and defensive assets, while currencies