


Large Gains in Altcoins
FXOpen

Altcoins are finally getting a break from the non-stop selling. Today 6 out of the top 10 alts are showing strong gains versus the US Dollar. The gains are bit higher versus bitcoin because BTC/USD is down around 2 percent today. Alternative crypto-currencies, ‘altcoins’ or ‘alts’ is the term used for all crypto-coins except bitcoin.
Ether Still in Range
Despite being up 5.25% today and 17 % since our last update, ether is still in a trading range (vs BTC) on the daily charts. Against the U.S. Dollar, ether peaked above the $400 round figure earlier today and is nearing its all-time high at $415 dollars.
As you can see on the chart below, ETH/BTC hasn’t broken the two important swing points at 0.03712 on the downside and 0.05545 BTC on the upside.
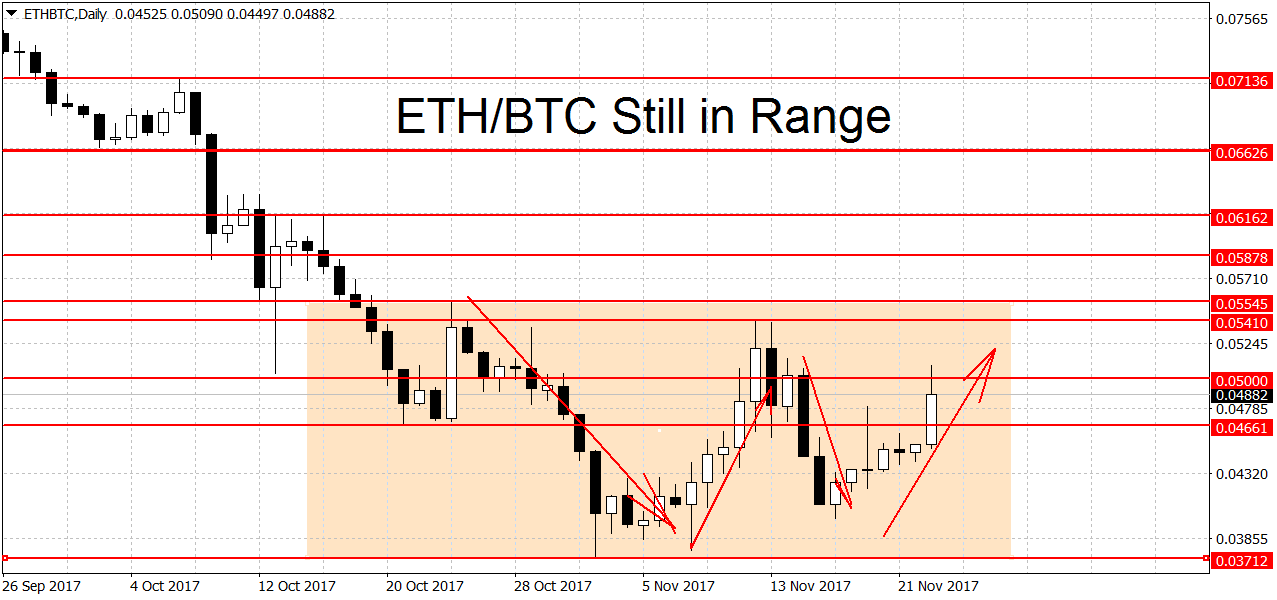
No clear trend can emerge until one of these levels is decisively broken. Below 0.05545 we find two weaker resistance levels at the 0.05 round figure followed by last week’s high at 0.0541. On the longer-term charts we have a downtrend on the weekly but uptrend on the monthlies.
Dash Gains 31 Percent
Dash is up over 31 percent versus bitcoin since last Thursday. Back then we traded at 0.05231 BTC while now DSH/BTC is seen quoted at 0.06834 BTC.
To end the current rally the bears will have to push the pair below the 0.05 round figure. Support above here can be found at the 0.0515 swing low, followed by the former highs at 0.05402 and 0.0562 BTC and the 0.06 round figure.
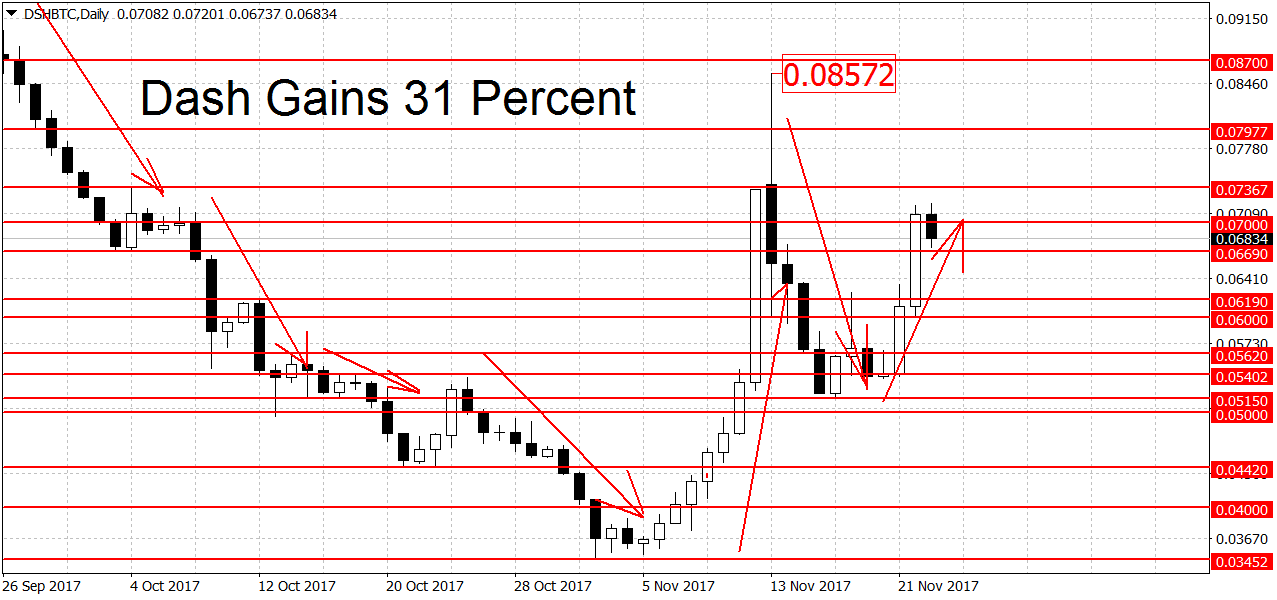
We have weak resistance levels above current prices at 0.07 followed by today’s high at 0.07201 BTC. Further up stronger resistance can be seen at 0.07367, 0.07977 BTC and the 0.08 round figure. This month’s spike high at 0.08572 BTC is another potential resistance level. You can see more notable levels on the chart above. On the longer-term charts, DSH/BTC is range-bound on the weekly but bullish on the monthlies.
Bitcoin Down Slightly
Bitcoin prices are trading a bit lower compared to our last update. We are trading at $8,125 dollars per coin right now, down from $8,320 on Tuesday.
The uptrend is still in place, however. To end it the bears will have to push BTC/USD below the $6,291 swing low. A break below this month’s low at $5,426 dollars would start a new BTC downtrend. On the longer-term weekly and monthly charts, bitcoin is in rally mode as well.
FXOpen – Online broker for cryptocurrency trading.
FXOpen offers the world's most popular cryptocurrency CFDs*, including Bitcoin and Ethereum. Floating spreads, 1:2 leverage — at your service (additional fees may apply). Open your trading account now or learn more about crypto CFD trading with FXOpen.
*Important: At FXOpen UK, Cryptocurrency trading via CFDs is only available to our Professional clients. They are not available for trading by Retail clients. To find out more information about how this may affect you, please get in touch with our team.
This article represents the opinion of the Companies operating under the FXOpen brand only. It is not to be construed as an offer, solicitation, or recommendation with respect to products and services provided by the Companies operating under the FXOpen brand, nor is it to be considered financial advice.
Stay ahead of the market!
Subscribe now to our mailing list and receive the latest market news and insights delivered directly to your inbox.


Latest articles

EUR/USD Eyes Gains As USD/CHF Weakness Deepens Again
EUR/USD started a fresh increase above 1.1700 and 1.1720. USD/CHF declined further and is now struggling below 0.7835.
Important Takeaways for EUR/USD and USD/CHF Analysis Today
· The Euro started a decent increase from

Apple: Earnings Day Above the Activity Zone
On 30 April, after the market close, Apple Inc. will release its financial results for the second quarter of fiscal 2026. The consensus forecast, based on estimates from 31 analysts, points to revenue of around $109.7 billion, with expected

USD/JPY and USD/CHF Near Key Levels: The Dollar Supported by the Fed
The US dollar continues to trend upwards following the Federal Reserve meeting, drawing support from the regulator’s moderately hawkish stance and comments by Jerome Powell. Markets interpret the Fed’s rhetoric as a signal that restrictive policy is likely