Litecoin drop 11%, EOS fell by 13%
LTC/USD
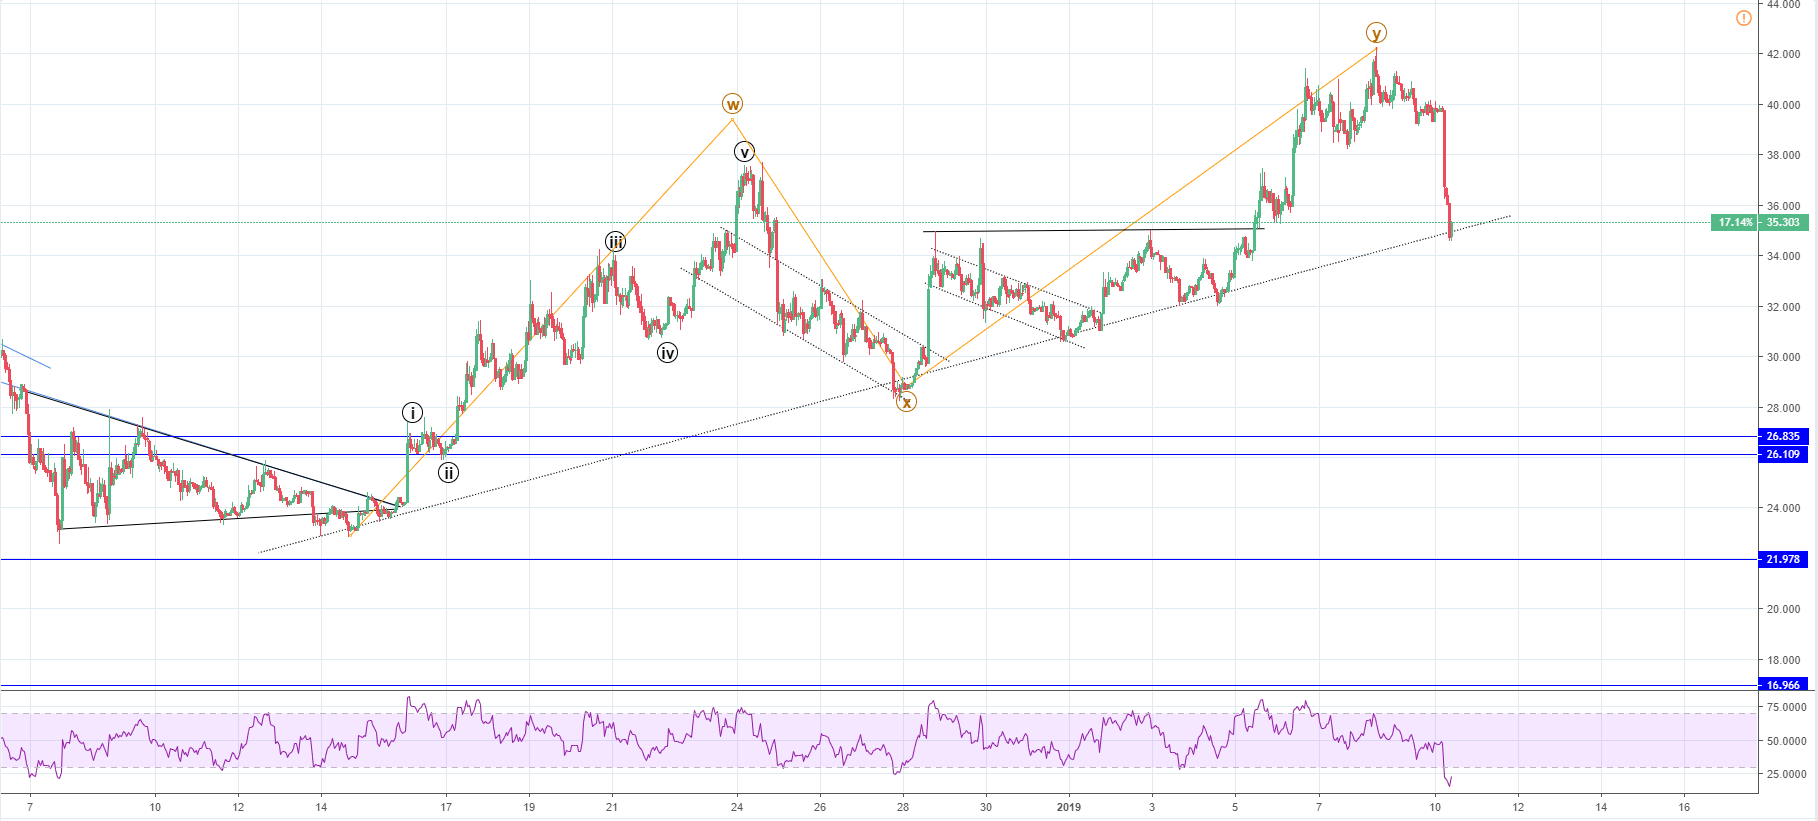
During the week the price of Litecoin fell from $40.113 on Monday to the current levels at around $35.40. Thus, the cryptocurrency has depreciated in price by 11.83%. The price went further up to around $42 area on Tuesday making a higher high surpassing the previous one at $37.312. From there the altcoin fell quickly to $34.57 and has recovered to its current level at $35.358.
On the hourly chart, the price dropped from the $39.732 level today, decreasing by 12.62% in one go. The LTC/USD is on the current uptrend support line now and has bounced off of it nicely as since the interaction occurred 1.95% green candles were formed. This isn’t still enough to say that it won’t continue going lower and break the support level as the momentum behind the sell-off looks strong.
Tuesday’s high at $42 was the higher high in the current uptrend which is corrective in nature and I have labeled it as a Minute WXY. As the correction might be over on the Y wave, we might see a start of the trend continuation and the development of the first impulsive move to the downside. The second option is the correction gets prolonged by two more waves W and Z. In this case, the move to the downside from $42 to the current levels would be the second corrective wave X.
For now, the uptrend support line looks strong enough to hold the price. But depending on the recovery that is currently in play, we are going to get an equal amount of the buyer’s momentum that will keep the price above that level. RSI was at 15.79% at its lowest point which indicates strong oversold conditions on the hourly chart. Considering that the price has found support on the uptrend support line and the horizontal level which served as resistance from where the price broke out, we are most likely going to see the price recover from here.
The increase from this level could be
1) either the final wave Z (if this correction gets prolonged by two more waves) – in this case, the price action would form an ascending channel as another higher high would be made,
2) or it could very likely be the second impulse wave.
But in either case, I would be expecting an increase to at least $37-38 area which is the first resistance point to the upside.
EOS/USD
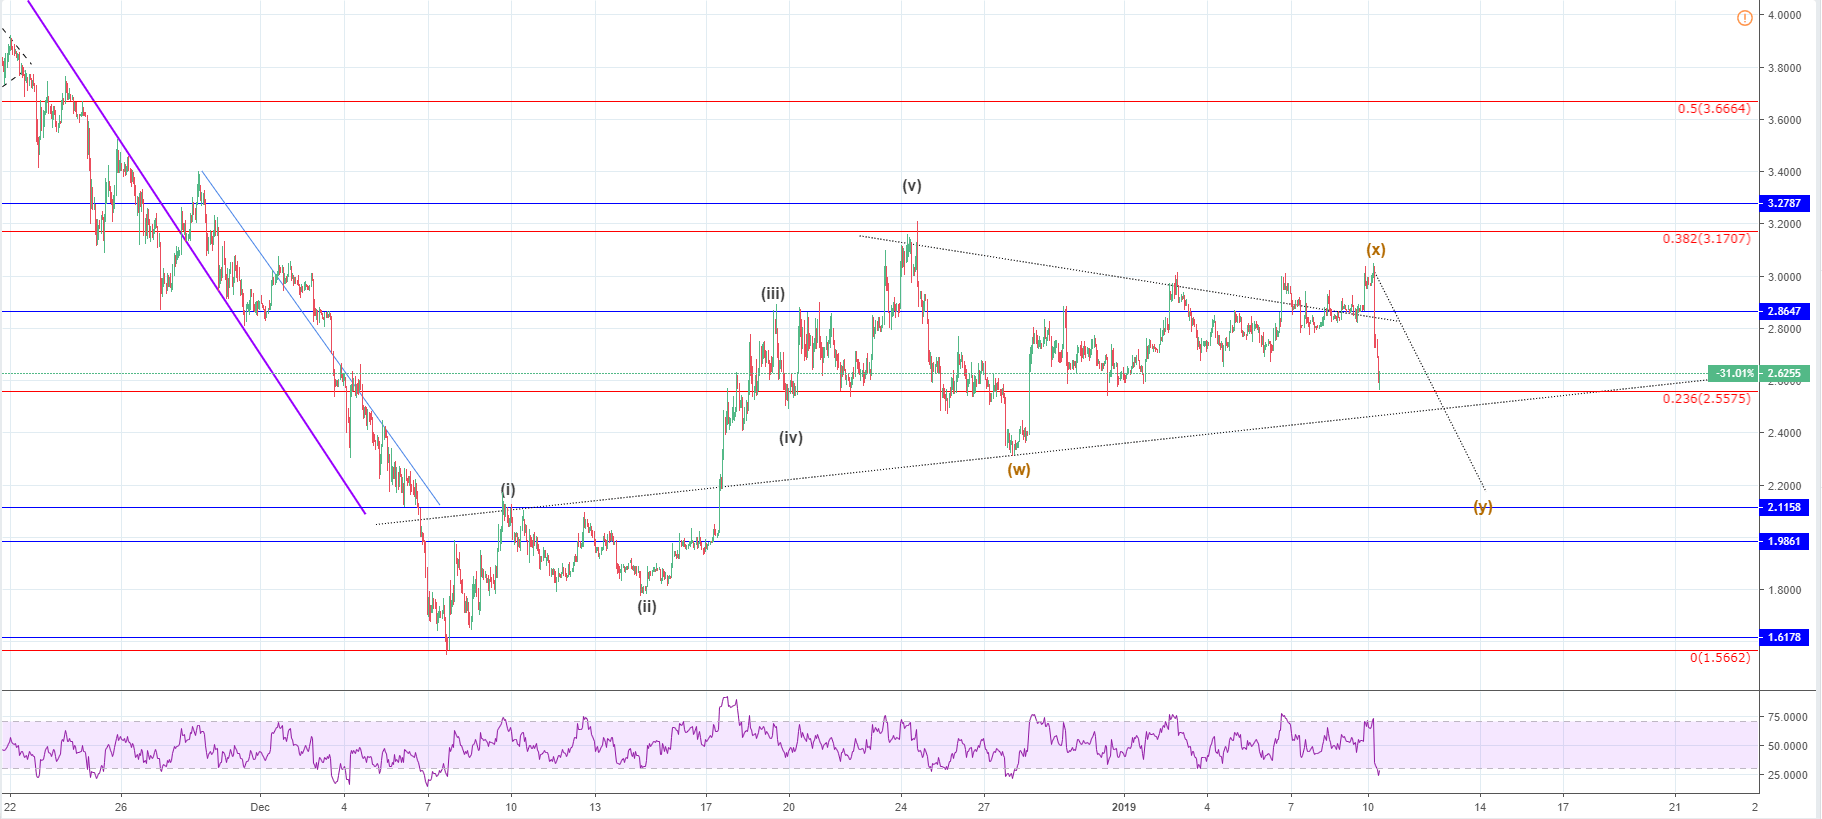
On Monday the price of EOS was $2.96. The next day the cryptocurrency fell to $2.8 and stayed there until yesterday when it increased again reaching $3.038 at its highest point.
On the hourly chart, the EOS/USD price has at first started breaking out from the symmetrical triangle area on the upside but it then resulted in a fakeout as the price fell from there to back inside the area, came to 0.236 Fibonacci level and interacted with it leaving a wick. The cryptocurrency pair is currently at $2.62 which is 13.62% drop in price today from the slightly above $3 level.
Same to Litecoin, the price has fallen quickly indicating strong marker correlation. But in the EOS case, the RSI reached 23.94% at its lowest point on the hourly chart. The fakeout that we saw was the X wave from the Minute WXY correction. Thus, more downside would be expected from here. Considering that its the final wave Y the price will most likely move to the downside in the impulsive 12345 manner. Projecting the W wave length on to the ending point of the X wave we can come to the approximate target area which is at $2.17.