Lots of Volatility, Little Price Change
Lots of volatility but little price change. This is how we can sum up the last seven days in BTC and LTC. Both cryptos are currently quoted less than 1 percent away from the price noted last Tuesday. Bitcoin is trading at $1057 versus $1062 back then, while LTC/USD is quoted at $4.124 vs $4.120 dollars per coin.
Lots of Volatility, Little Price Change
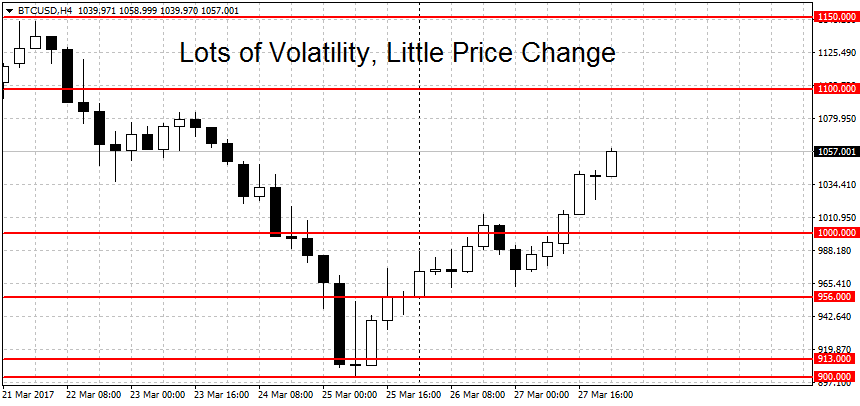
If you were gone for a week and just checked the price of bitcoin, you would’ve thought nothing major happened. While BTC is trading only half a percent away compared to last Tuesday, volatility is through the roof, as can be seen on the chart below.
First, we got a precipitous decline caused by contentious fork fears, during which a low of $901 was hit. From here a strong recovery emerged and we are now trading $156 higher. The meltdown in altcoin prices during the past few days probably helped with this somewhat.
Despite the sharp bounce from the lows, however, the trend remains down on the short-term charts. To end it, the bears will have to push prices above the $1,150 swing high. A new uptrend requires a break above the all-time high ($1,269 on FXOpen). The highs reached on other exchanges were in the $1,330-$1,360 range.
On the lower end, we have some support at $1,000 round figure although a stronger support area can be found in the $900 – $913 dollars range. A breakdown below here could exacerbate the losses. The longer-term charts for BTC/USD (weekly and monthly) are still in bullish territory.
Litecoin Barely Changed
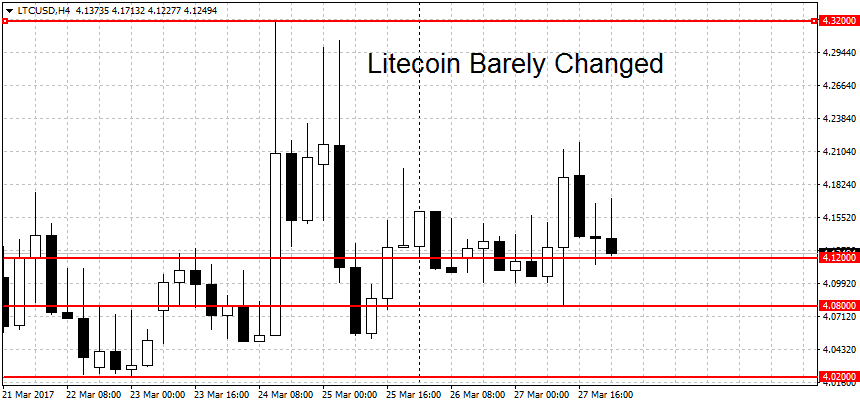
Litecoin prices are barely changed compared to one week ago. We’re still trading near $4.12 dollars per coin. But similarly to bitcoin here too large swings were seen, as shown below.
The highest high during the past seven days stands at $4.32 while the lowest low was at $4.02, a price difference of over 7 percent. The trend in LTC/USD is still up and a break below $3.88 is needed to end it. We have support below here at the $3.67 swing low. A decisive break below this level could start a new downtrend in prices.
On the upside, resistance can be found on March 2nd (and March 24th) swing high of $4.32, closely followed by the $4.50 round figure. Higher still we have this month’s high at $4.57 and the multi-month high at $4.60. A clearing of this resistance area could lead to more gains. The weekly LTC charts are slightly bullish but the monthlies remain neutral.