LTC and EOS - Ascending channels were corrective
LTC/USD
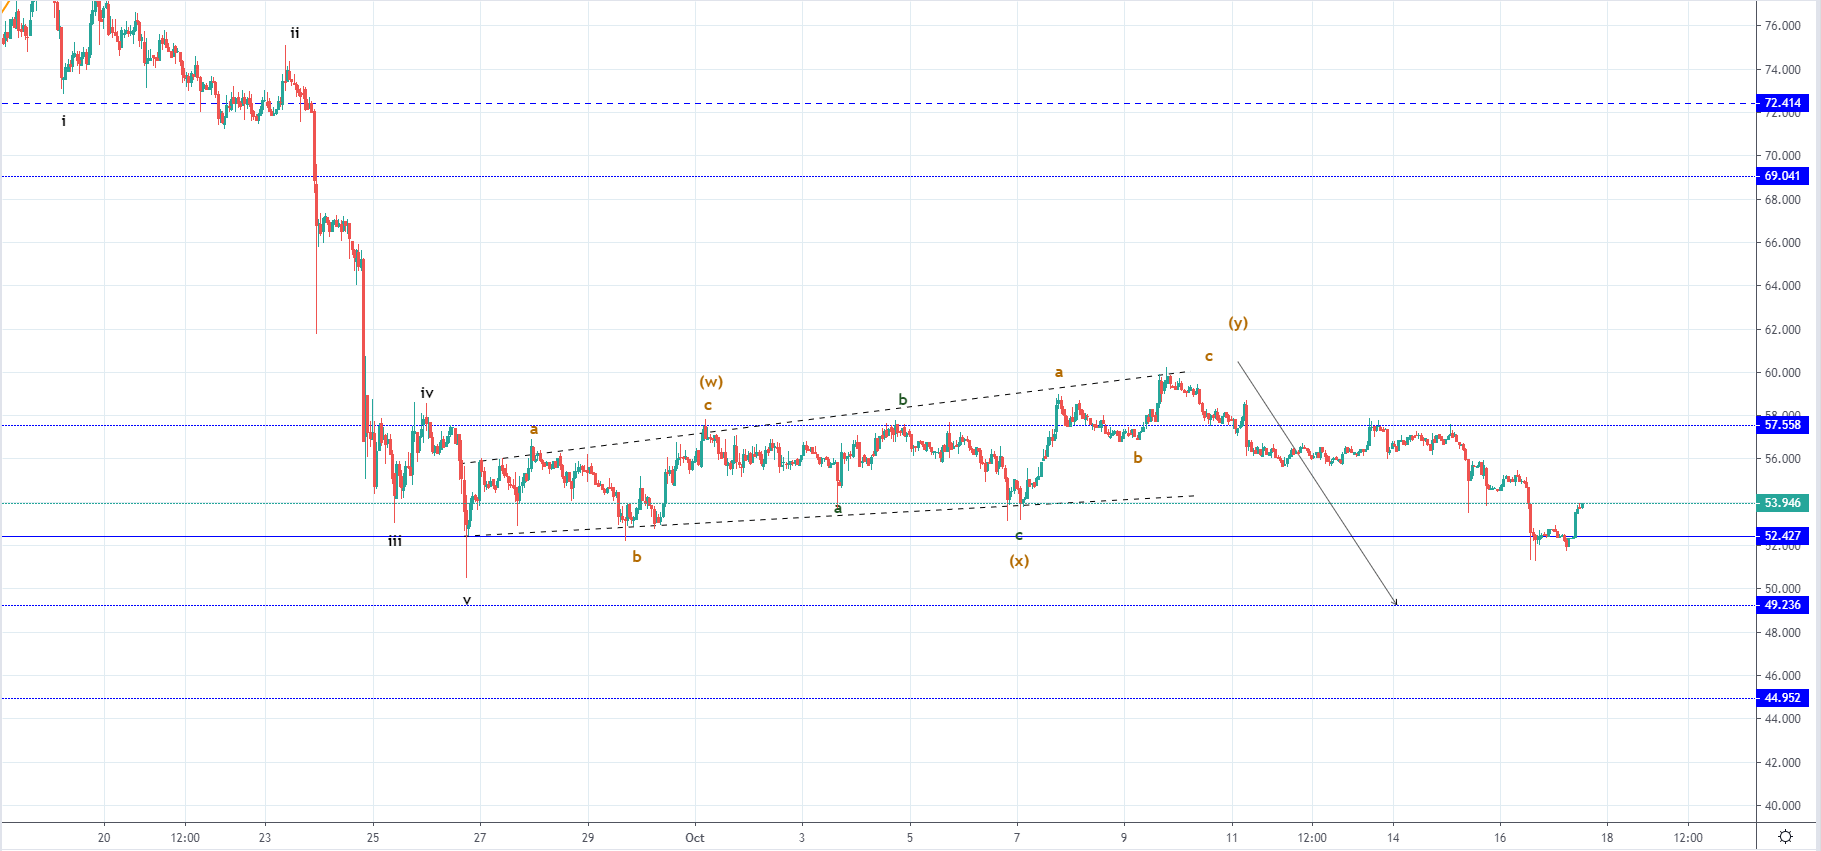
From last Wednesday when the price of Litecoin reached $59.991 at its highest point measured to today’s low at $51.864 we have seen a decrease of 13.55%. As you can see from the hourly chart below the price came up last week to the ascending channels resistance level and got rejected like expected which is why we have seen the move to the downside below it’s support level.
Interaction with the horizontal support level today has caused a bounce with the price getting into an upward trajectory again and is showing signs of bullishness but is currently retesting the X wave low vicinity for resistance which could also serve as an indication of the future price action pathway. If the price continues moving above the current level, retest the $52.4 level and finds support there yet again it could mean that we have seen the completion of the descending move. But more likely the downfall is yet to develop fully in which case I would be expecting the price below $50.
EOS/USD
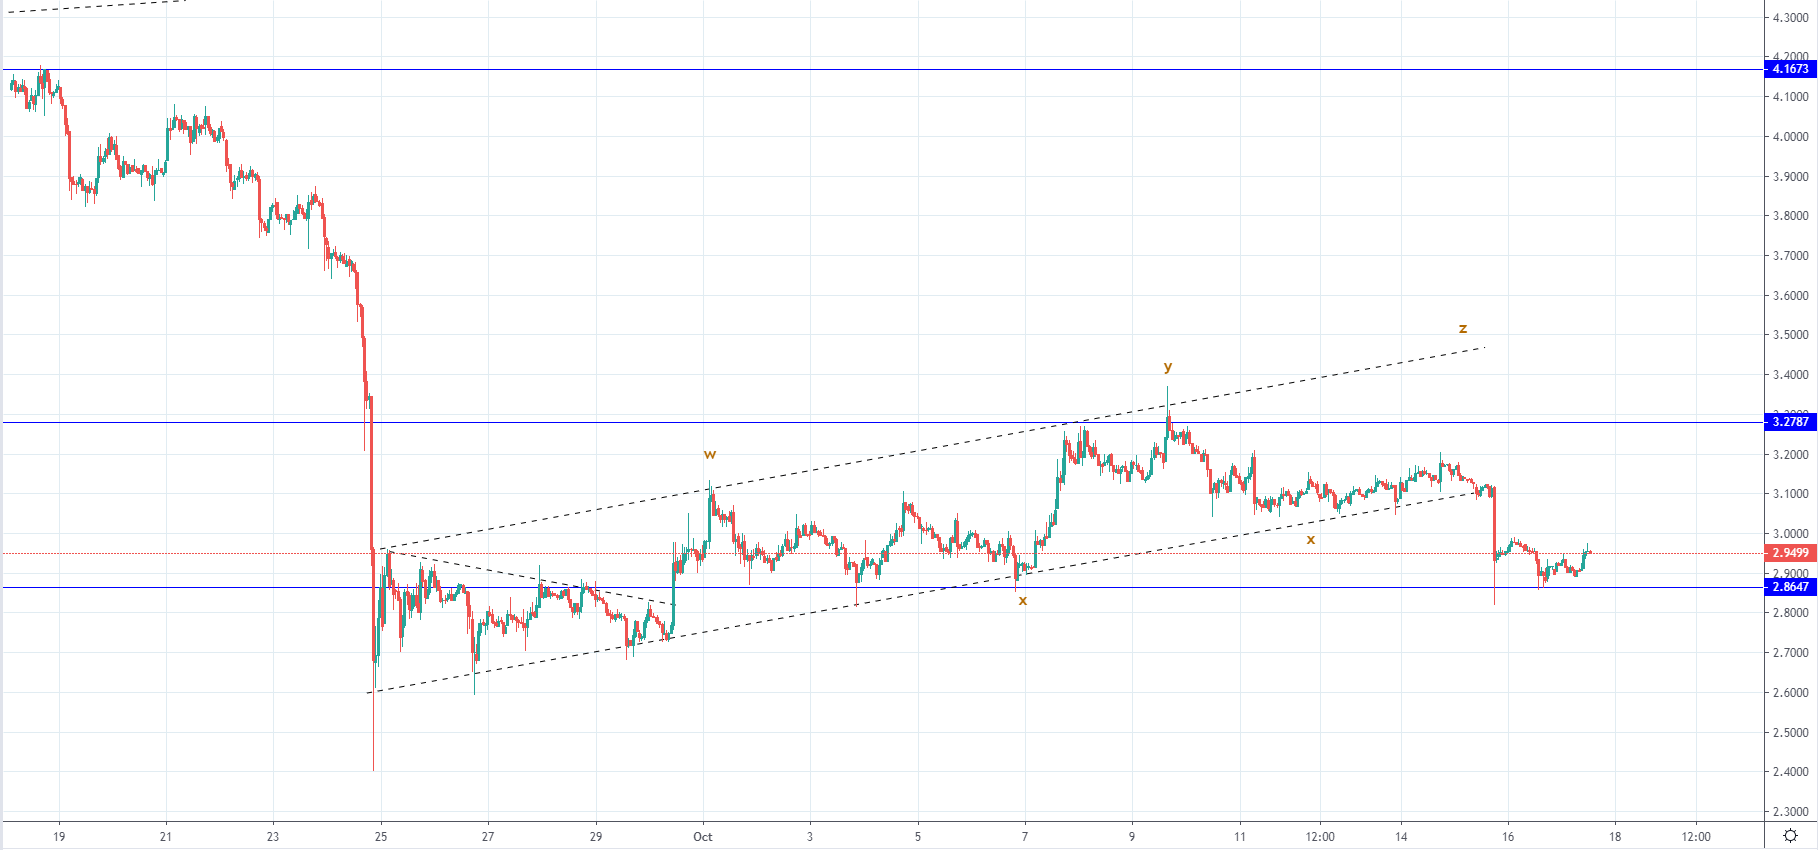
The price of EOS has been in a downtrend from last Wednesday like Litecoin and has decreased by 13.81% coming from Wednesday’s high at $3.319 to $2.86 at its lowest point today.
Similarly like in the case of Litecoin I would be expecting downtrend continuation from here below the horizontal support level and potentially as a retest of the $2.6 low which if doesn’t serve as another support point will result in a further downfall to $2.11 which is the next significant horizontal level in line.