LTC and EOS - Breakout seen but momentum slowing down
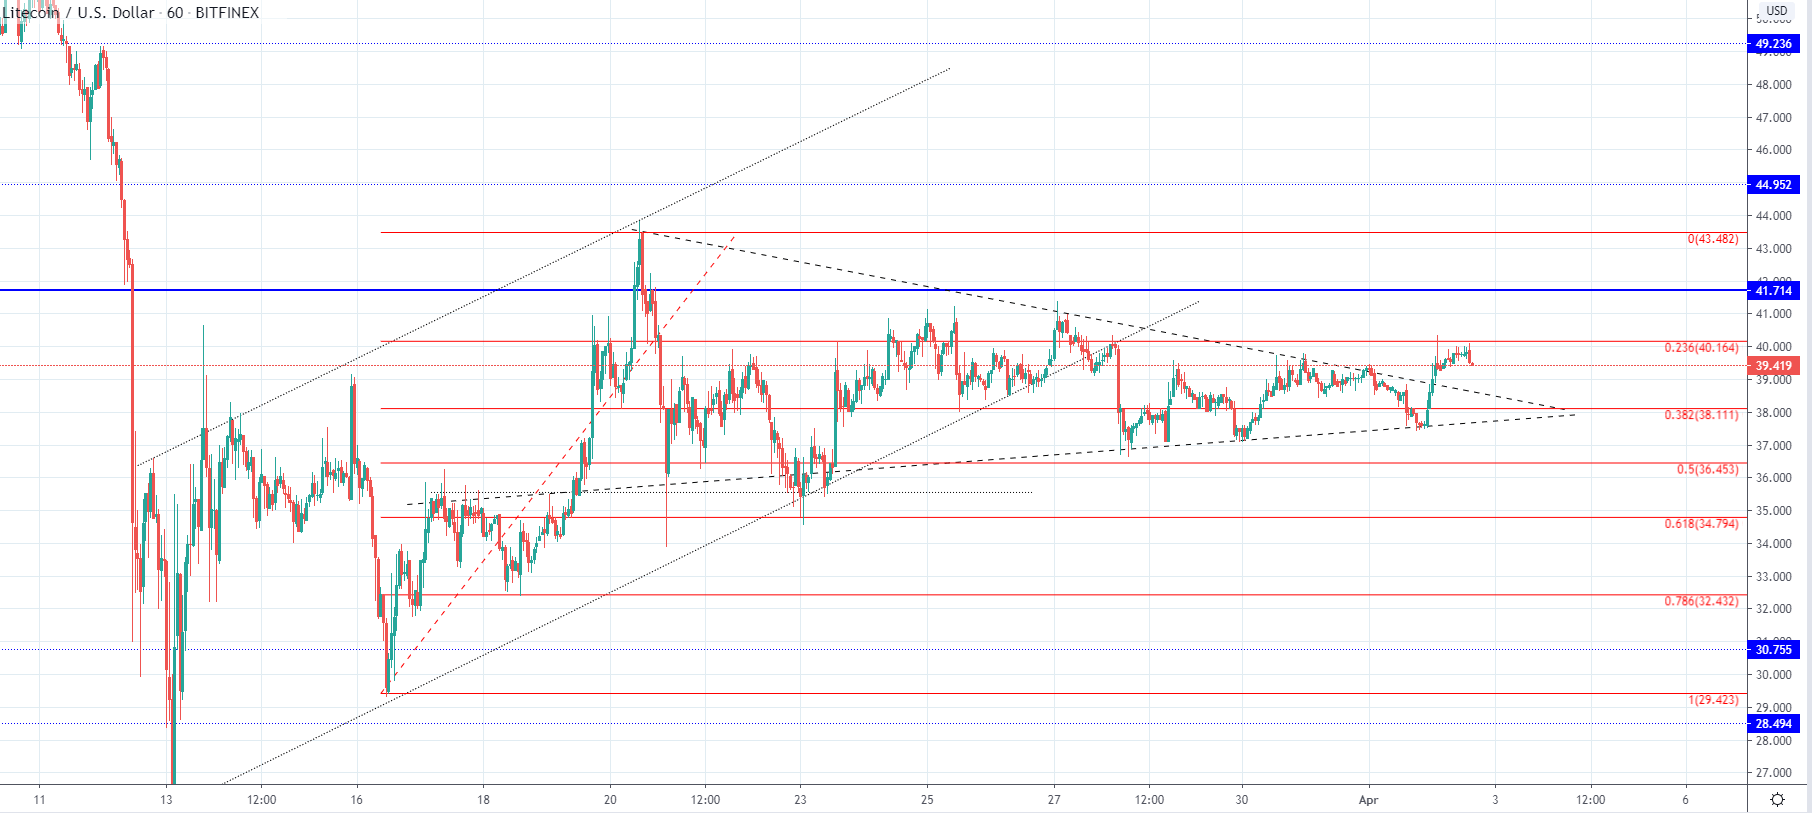
LTC/USD
The price of Litecoin has increased by almost 7% today, coming from yesterday’s low at $37.55 to $40.168 on today’s high. It is being traded at $39.44 at the moment with the momentum slowing down and is in the downward trajectory.
We haven’t seen the five-wave impulse wave to develop as after the then presumed 3rd wave that came to $43.48 we have seen the price starting to move in a sideways manner. The length of this sideways move makes it improbable of being the 4th wave which is why the count got invalidated, but it is still unclear which corrective structure this will turn out to be. For it looks like it might end with another increase to the upside and would be the 2nd three-wave correction after which another to the downside could be expected as the complex WXY correction develops.
If the price doesn’t continue moving above the 0.236 Fibonacci level I would be expecting a downside move below $37, but it looks more likely that from here we are to see further increase above the mentioned level in which case the next significant resistance level would be at $41.7.
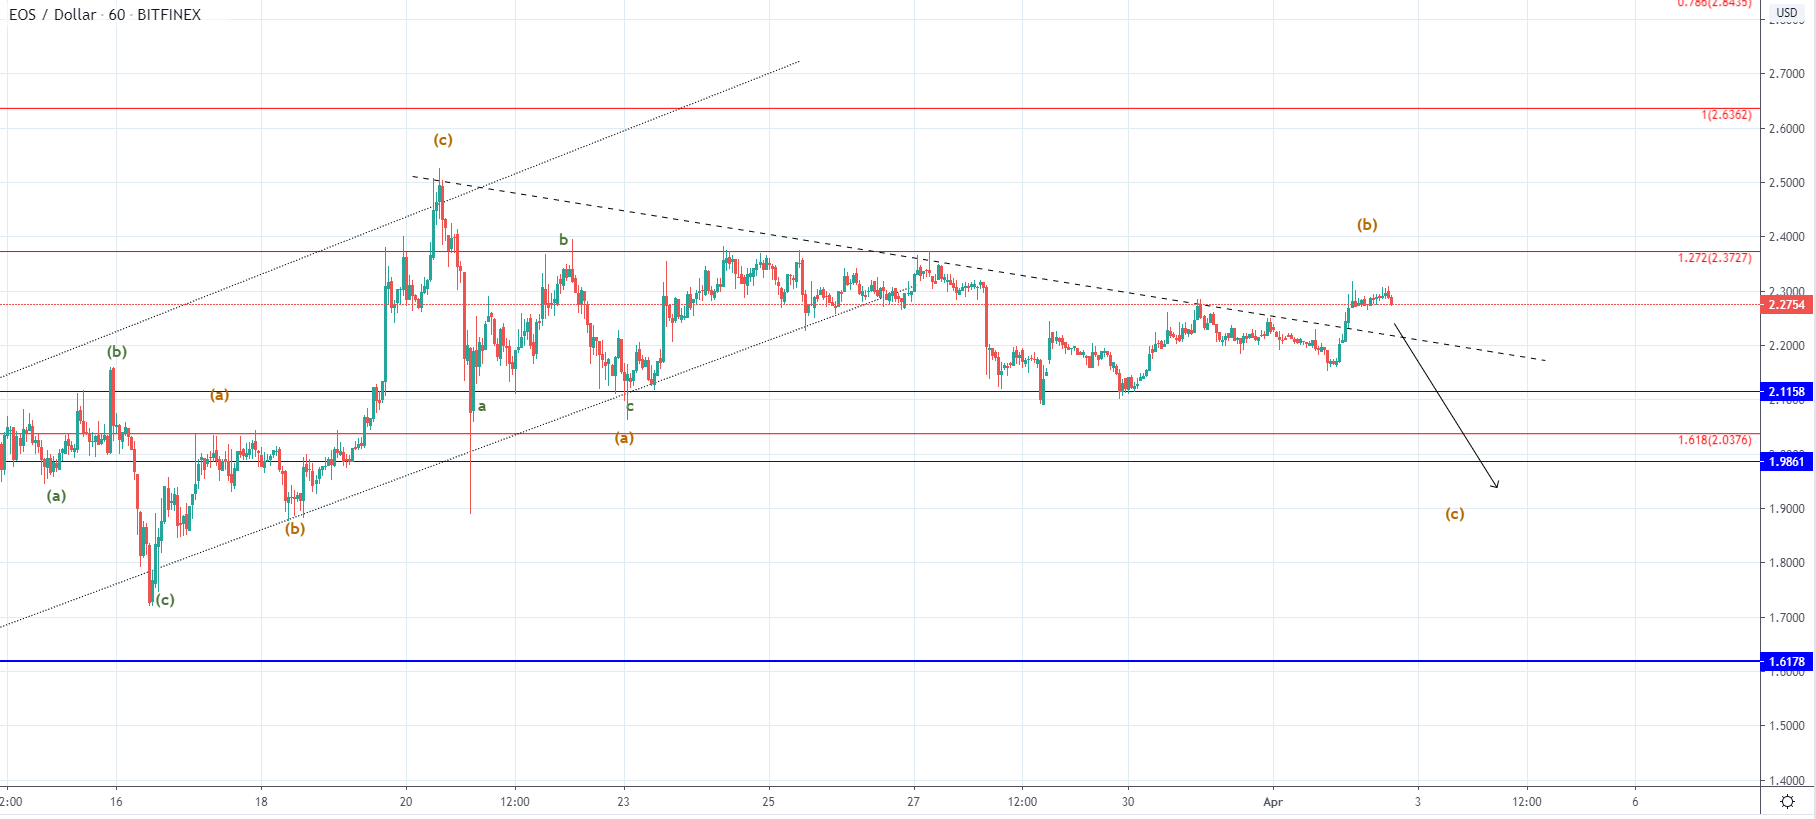
EOS/USD
From yesterday’s low at $2.161 we have seen an increase of 6.82% in the price of EOS as it came up to $2.3 at today’s high. Like in the case of Litecoin it is currently expecting a minor retracement with further short-term downside potential.
This is why if the price comes down to the descending trendline, and finds support on the retest I would be expecting further increase at least to the 1.272 Fibonacci level at $2.372. But if the price goes back below it I would be expecting a breakout to the downside below $2.11 level.