


LTC and EOS - Breakout seen from the triangle but not from the ascending channel
FXOpen

LTC/USD
The price of Litecoin has continued increasing since the start of November and has broken out from the symmetrical triangle on the upside. An increase of 11.85% was seen, measured to the highest point made on today’s open which is at $64.32. From there another downturn has started with the price currently being traded at around $61.5 which is a decrease of 4.43%.
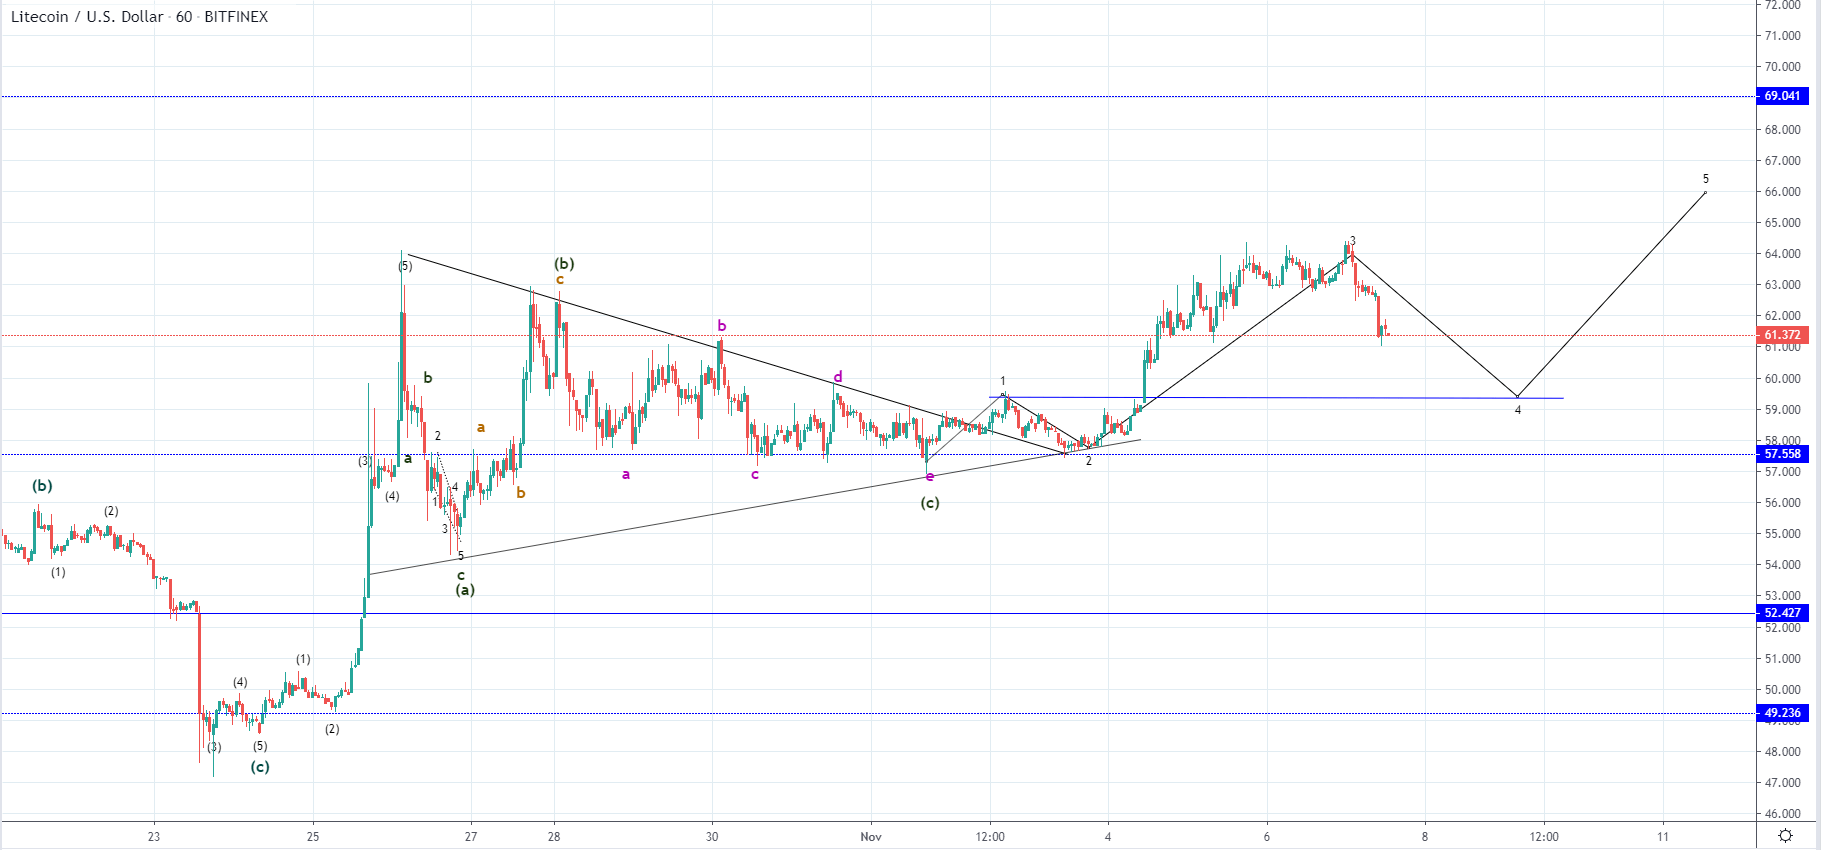
Looking at the hourly chart, you can see that the price of Litecoin undergone a corrective triangle in which we have seen three waves developing an ABC correction. As the price made this triangle after a five-wave move to the upside which looks impulsive in nature the current upside move is most likely its continuation and is likely to develop also in a five-wave manner.
This will be confirmed by the depth of the current downside move which is considered the 4th wave out of the impulsive move the upside which cannot enter the territory of the wave 2 which is at $59.34.
If the price continues moving below the mentioned level the count would be invalidated. In this case, the increase would have ended as a three-wave increase which would be considered corrective in nature and would indicate further downside potential for the price of Litecoin in the upcoming period.
EOS/USD
From the 1st of November when the price of EOS was sitting at around $3.22 we have seen an increase of 13.85% measured to the highest point the price has been yesterday which is at $3.67. Currently, the price is being traded at $3.47 and is still in a downward trajectory, from which similarly like in the case of Litecoin, we are to see if this increase is the start of the next impulsive move to the upside.
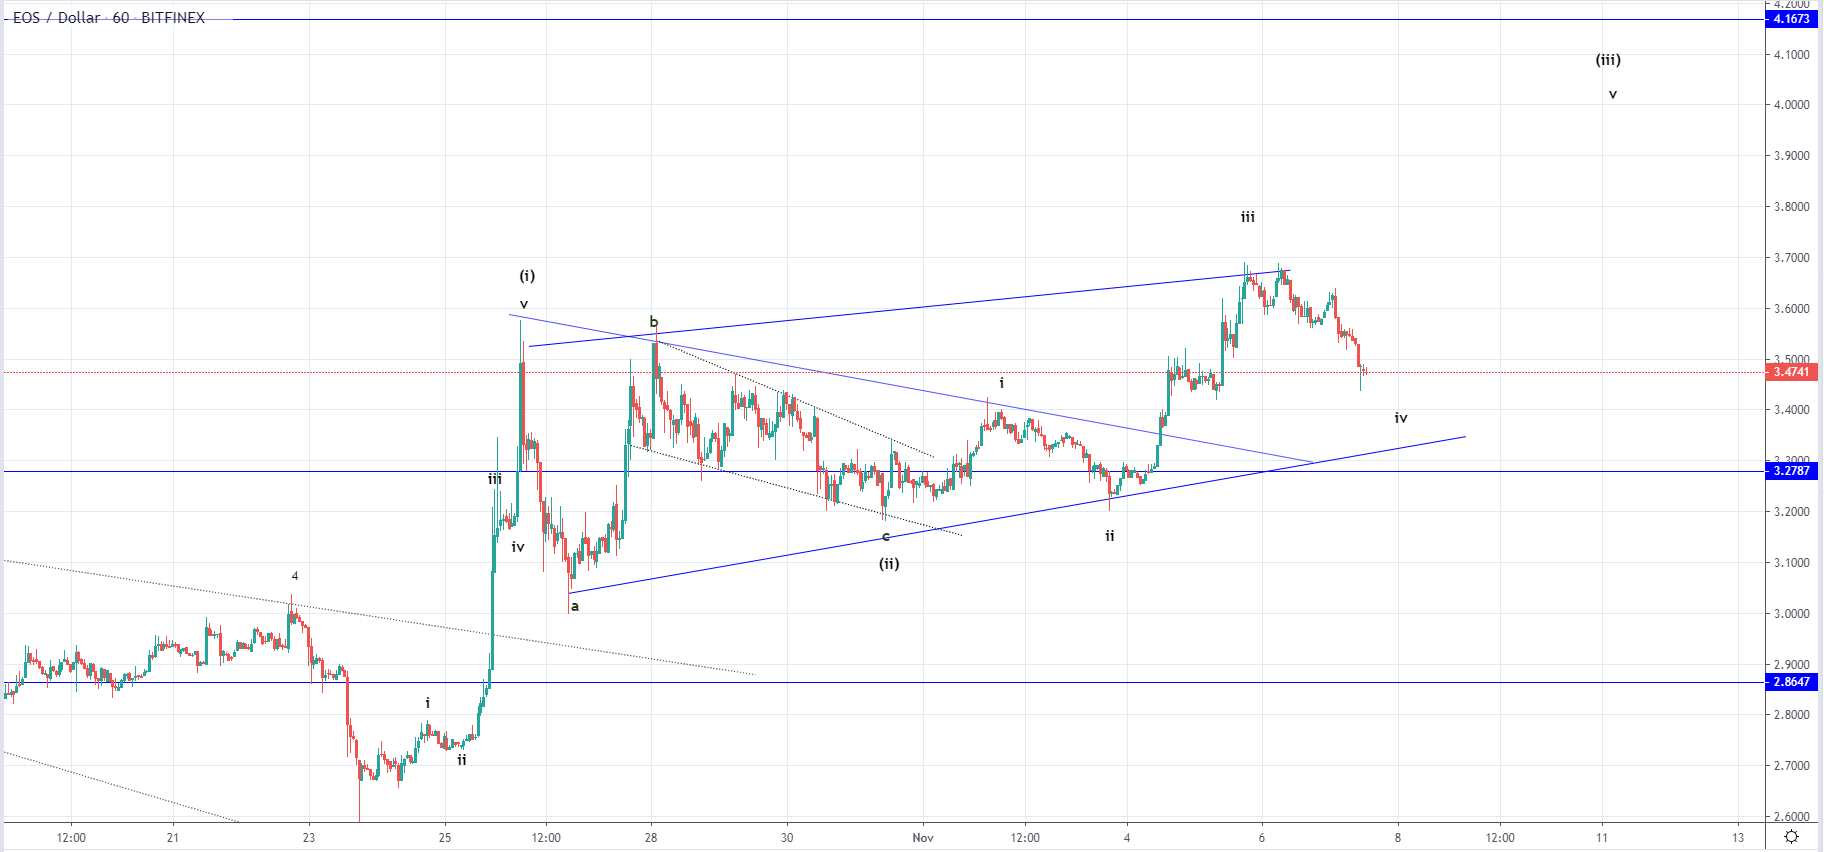 On the hourly chart, we can see that a breakout was made from the triangle in which the price was correcting until the 1st of November, but we haven’t seen a breakout from the ascending channel. Instead, the price interacted with the level and found strong resistance there as the price started an aggressive decline after. This means that we could be seeing the correction’s prolongation which also applies to Litecoin.
The 1st wave’s ending point which is at $3.399 will serve as a pivot point, as if the price continues moving below it, it would invalidate the presumed 12345 count and would point out that increase ended as a three-wave move with another structure to the downside developing before we can see the 3rd wave of the higher degree starting.
FXOpen offers the world's most popular cryptocurrency CFDs*, including Bitcoin and Ethereum. Floating spreads, 1:2 leverage — at your service (additional fees may apply). Open your trading account now or learn more about crypto CFD trading with FXOpen.
*Important: At FXOpen UK, Cryptocurrency trading via CFDs is only available to our Professional clients. They are not available for trading by Retail clients. To find out more information about how this may affect you, please get in touch with our team.
This article represents the opinion of the Companies operating under the FXOpen brand only. It is not to be construed as an offer, solicitation, or recommendation with respect to products and services provided by the Companies operating under the FXOpen brand, nor is it to be considered financial advice.
Stay ahead of the market!
Subscribe now to our mailing list and receive the latest market news and insights delivered directly to your inbox.


Latest articles

Apple: Earnings Day Above the Activity Zone
On 30 April, after the market close, Apple Inc. will release its financial results for the second quarter of fiscal 2026. The consensus forecast, based on estimates from 31 analysts, points to revenue of around $109.7 billion, with expected

USD/JPY and USD/CHF Near Key Levels: The Dollar Supported by the Fed
The US dollar continues to trend upwards following the Federal Reserve meeting, drawing support from the regulator’s moderately hawkish stance and comments by Jerome Powell. Markets interpret the Fed’s rhetoric as a signal that restrictive policy is likely

EUR/USD and GBP/USD consolidate ahead of the Fed decision
European currencies are showing subdued dynamics, entering a consolidation phase following their previous advance. Earlier, EUR/USD and GBP/USD broke out of their ranges and strengthened; however, the subsequent correction has led both pairs to retest the previously breached