LTC and EOS — Breakout Soon Expected!
LTC/USD
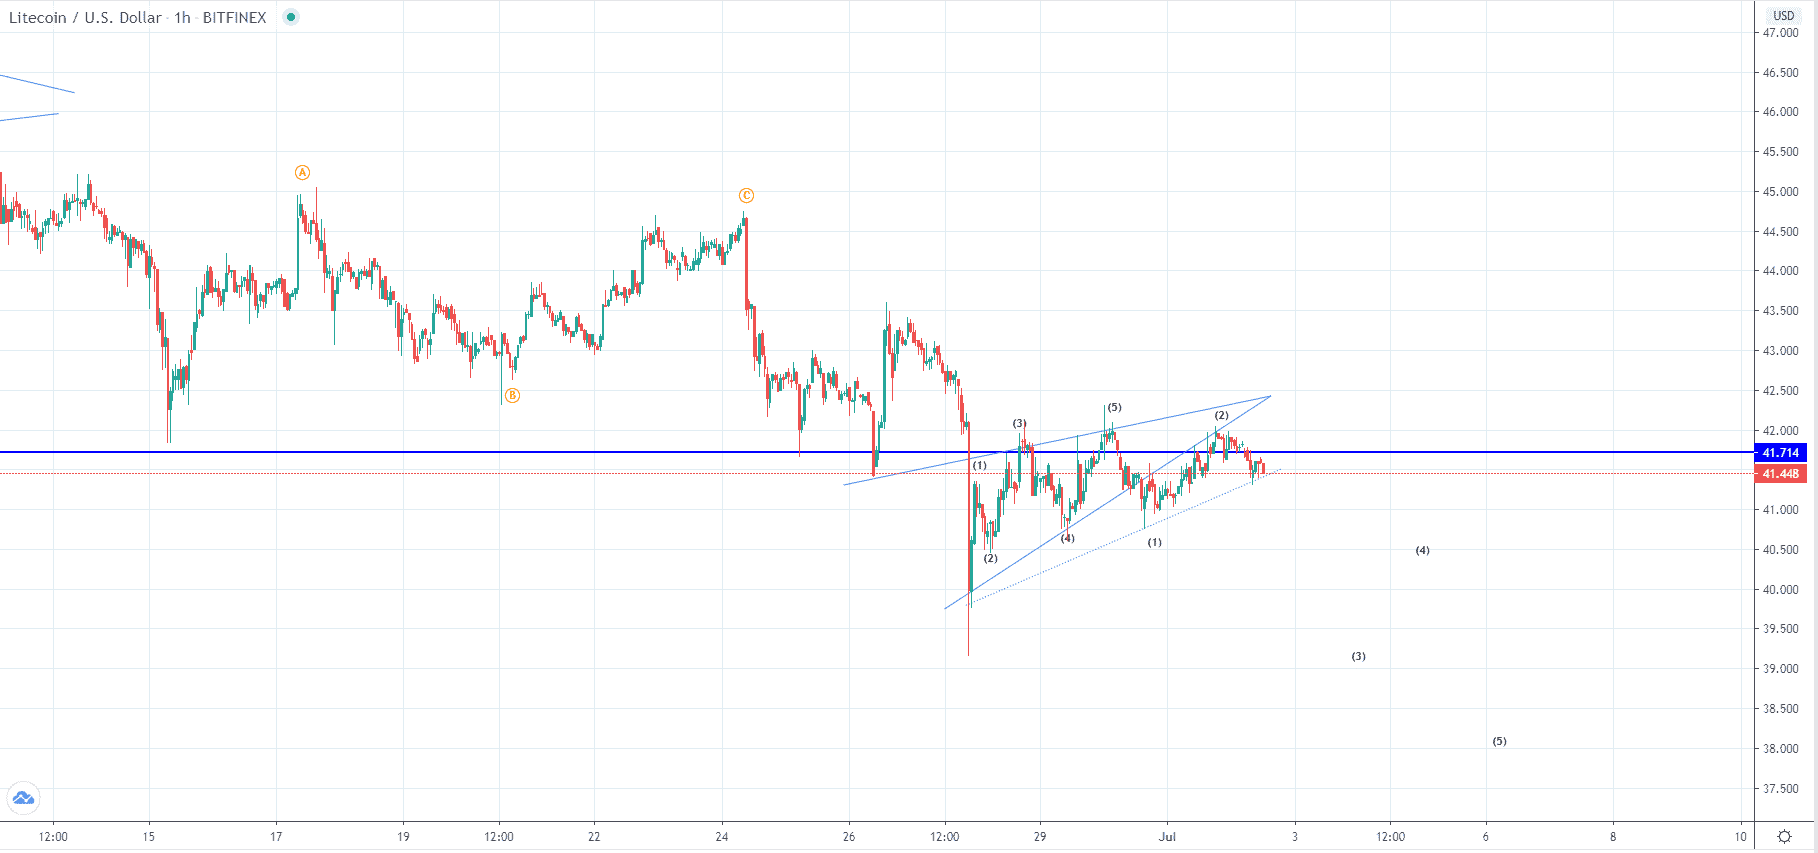
The price of Litecoin has been increasing from the 27th of June when it dipped below the $40 mark and spiked to the downside but managed to maintain above it after and was set into an upward trajectory, reaching $42 level at its highest point made on three occasions. Currently, it is being traded at around $41.448 and is in a downward trajectory from yesterday high overall.
If this is true then the next move that already started is another five-wave impulse to the downside out of the same degree count but would be the 3rd wave out of the even higher degree count and would mean that the price is headed for even more downside after. Another possibility could be that we are seeing a leading diagonal as the corrective wave ended on the 27th in which case the descending move which is expected would end as a three-wave one not going below the Jun’s low.
EOS/USD
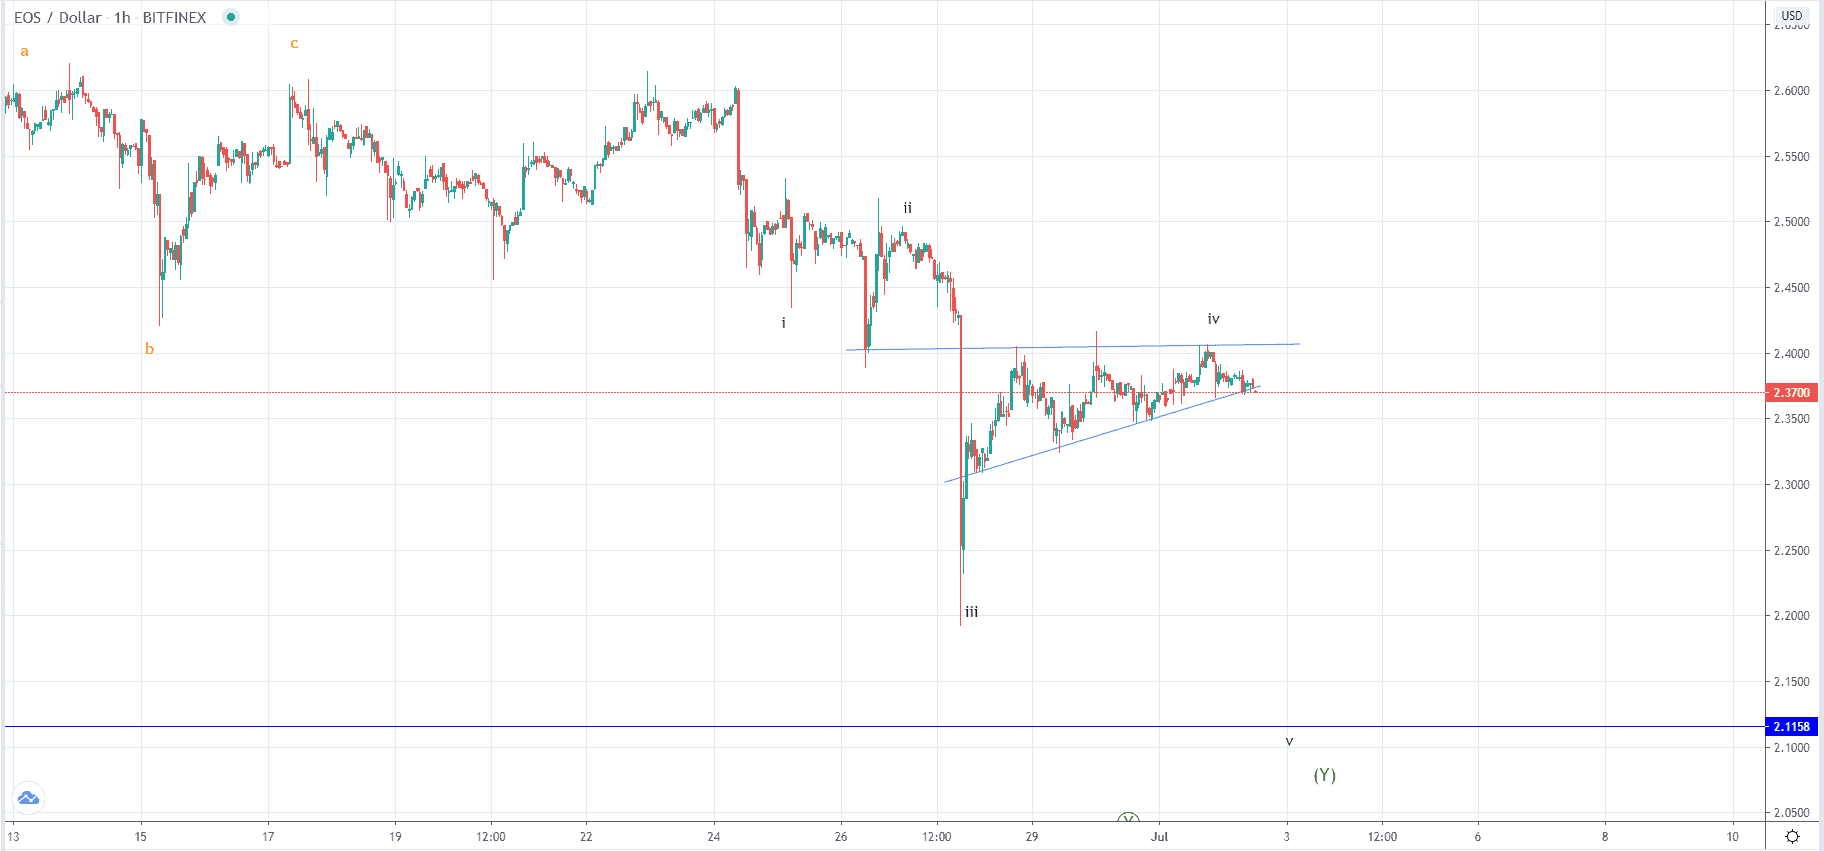
The price of EOS has made a decrease of 1.4% measured from yesterday’s high at $2.4 to the levels on which it is currently being traded which at $2.369.
Like in the case of Litecoin we have seen an ascending triangle forming with the price not being able to surpass its horizontal resistance level at around yesterday’s high vicinity on three occasions. Two logics could be in play here, first being that because of this the buyer’s pressure is to break the horizontal level which got weakened in the process and second that the last rejection is to set the price into a downward trajectory as it failed to continue it breakout attempt.
The wave structure implies the completion of the three-wave structure so we could have seen the development of an ABC to the downside but we could have also seen the development of the 3rd wave from a five-wave impulse in which case the seen ascending triangle would be its 4th wave. If the first is true we are to see a breakout to the upside above the mentioned horizontal resistance but if the second is true we are to see a breakout below the support level of the current ascending triangle leading the price potentially all the way down to $2.11 level.