LTC and EOS - Breakout to the downside
LTC/USD
On Monday, the price of Litecoin has been traded at $90.153 at its highest point but soon started decreasing to its significant horizontal support level at $84. As a breakout occurred from the horizontal support zone the price has fallen to $72.92 and spiked even further to $71.13 at its lowest point today which is a decrease of 21% since the start of the week.
As we’ve seen a breakout to the downside the next horizontal level which could serve as support would be at around $67.9 but the level is only a minor one which is why I don’t believe that we are going to see it holding the downward momentum. More likely this support point is to cause a temporary reversal which would be set to push the price back up for a retest of the broken significant horizontal zone at $84 before the downside movement continues below it to the next significant support zone which is at around $54-52 area.
EOS/USD
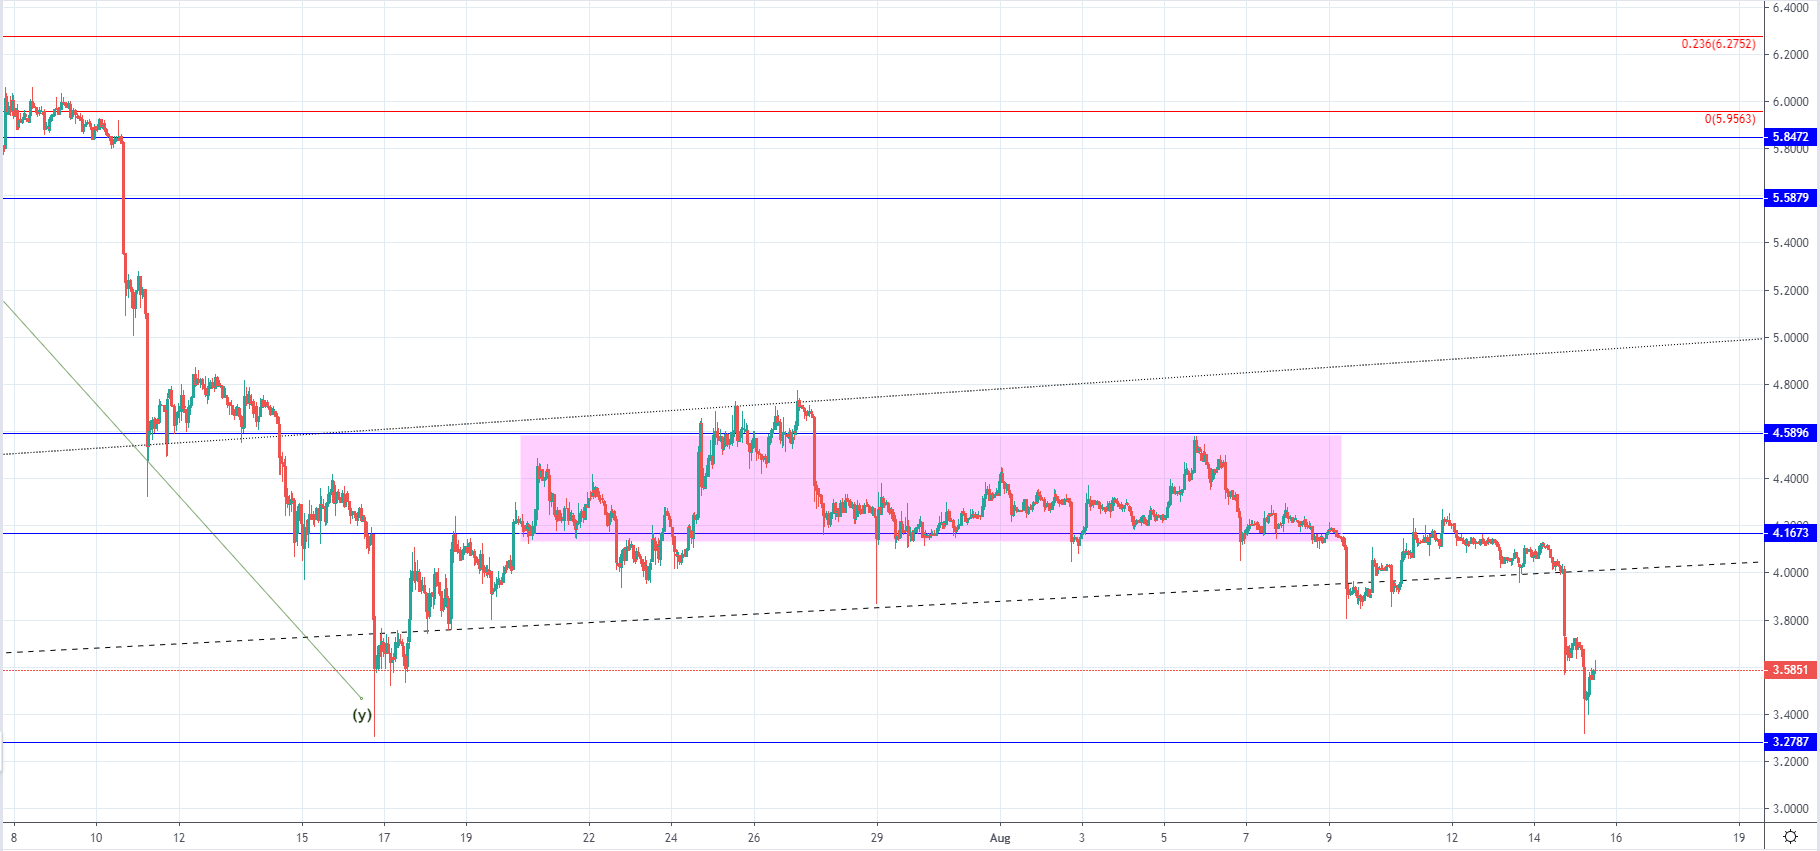
From Monday’s high at $4.239 the price of EOS has decreased by 22.12% as it fell to $3.3 at its lowest spike today. The price is currently being traded at around $3.59 as it started to recover but strong seller’s presence has been seen which is why the momentum is likely to continue.
The price found some support but this is going to be a temporary one which could set the price for a minor recovery for a retest of the broken support levels for resistance after which another downturn would be seen.