LTC and EOS - Correction developing
LTC/USD
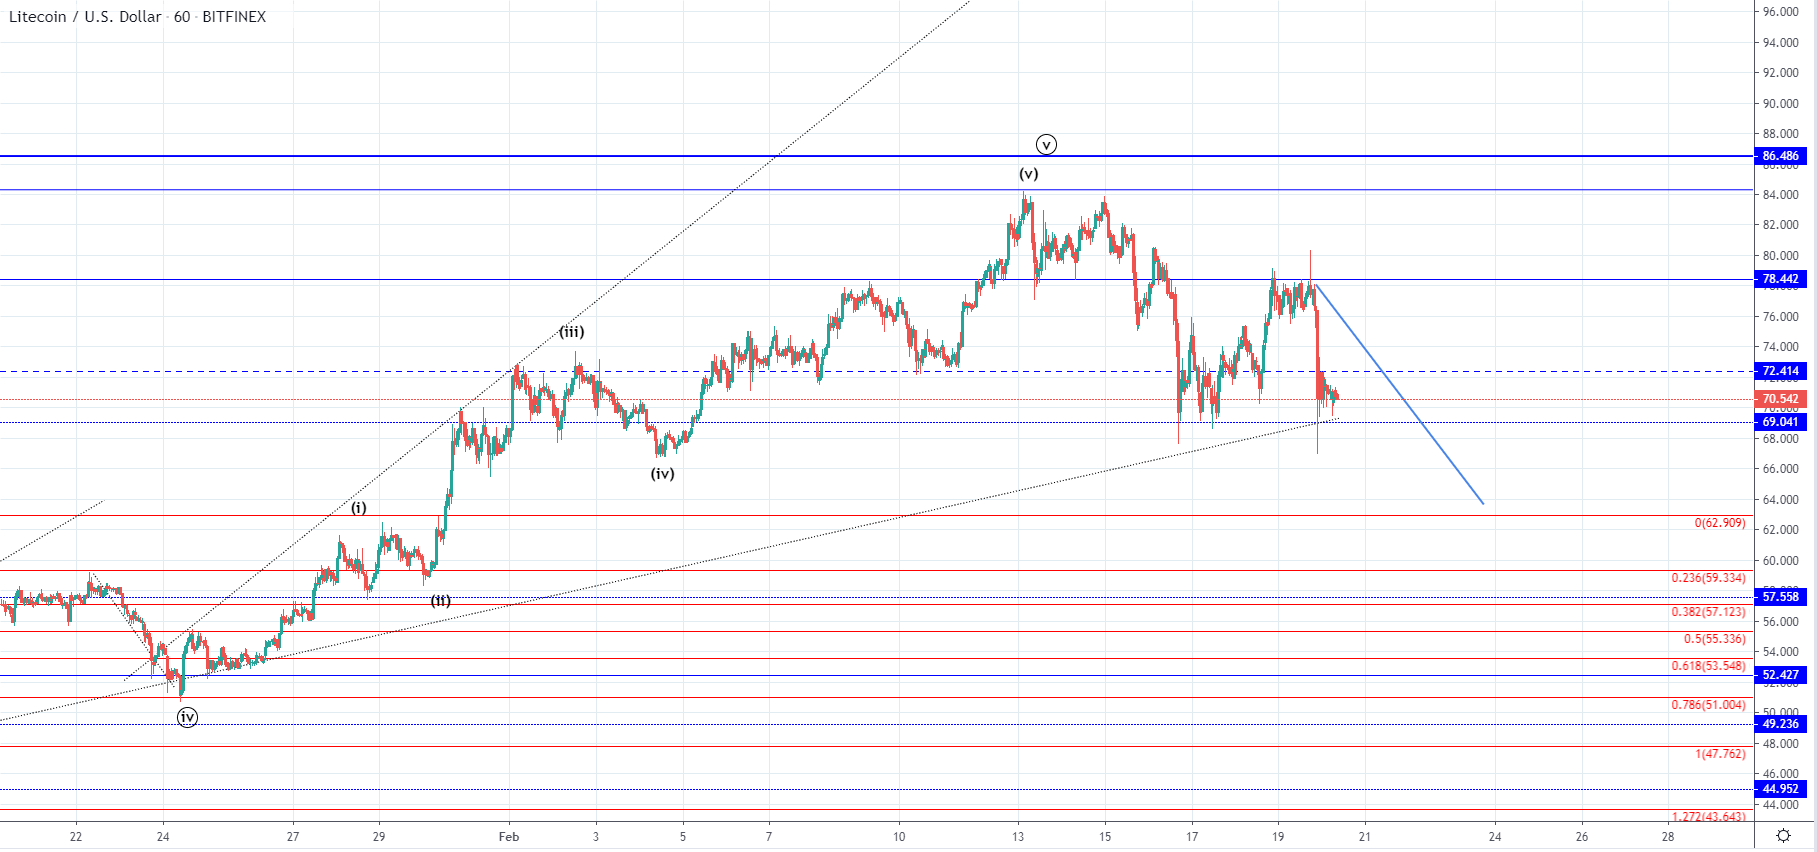
From yesterday’s high at $78 the price of Litecoin has decreased by 10.51% as it came down to $69.82 at it’s lowest point today. The price is currently being traded around those levels as it’s attempting to establish some support.
Looking at the hourly chart, we can see that the price came down to the ascending trendline and retested its intersection with the $69 horizontal level with a spike but the hourly candle closed above it leaving a large wick to the downside. This indicates that support is present at those levels but this might not be for much longer as we have seen strong bearish momentum since yesterday.
At the momentum, we can see a cluster being formed slightly above the prior low levels with a downward trajectory which can be interpreted as a sign of bearish pressure applied to the support levels below. This is why we are most likely to see a breakout to the downside with the price continuing to move below $69 level and potentially reach the 0 Fib level of the lower range which would bring the price of Litecoin at around $63.
If the price, however, manages to hold above the current levels a recovery could be seen but for now, it looks more likely that the price is to continue moving straight down as it came below the $72.414 horizontal level.
EOS/USD
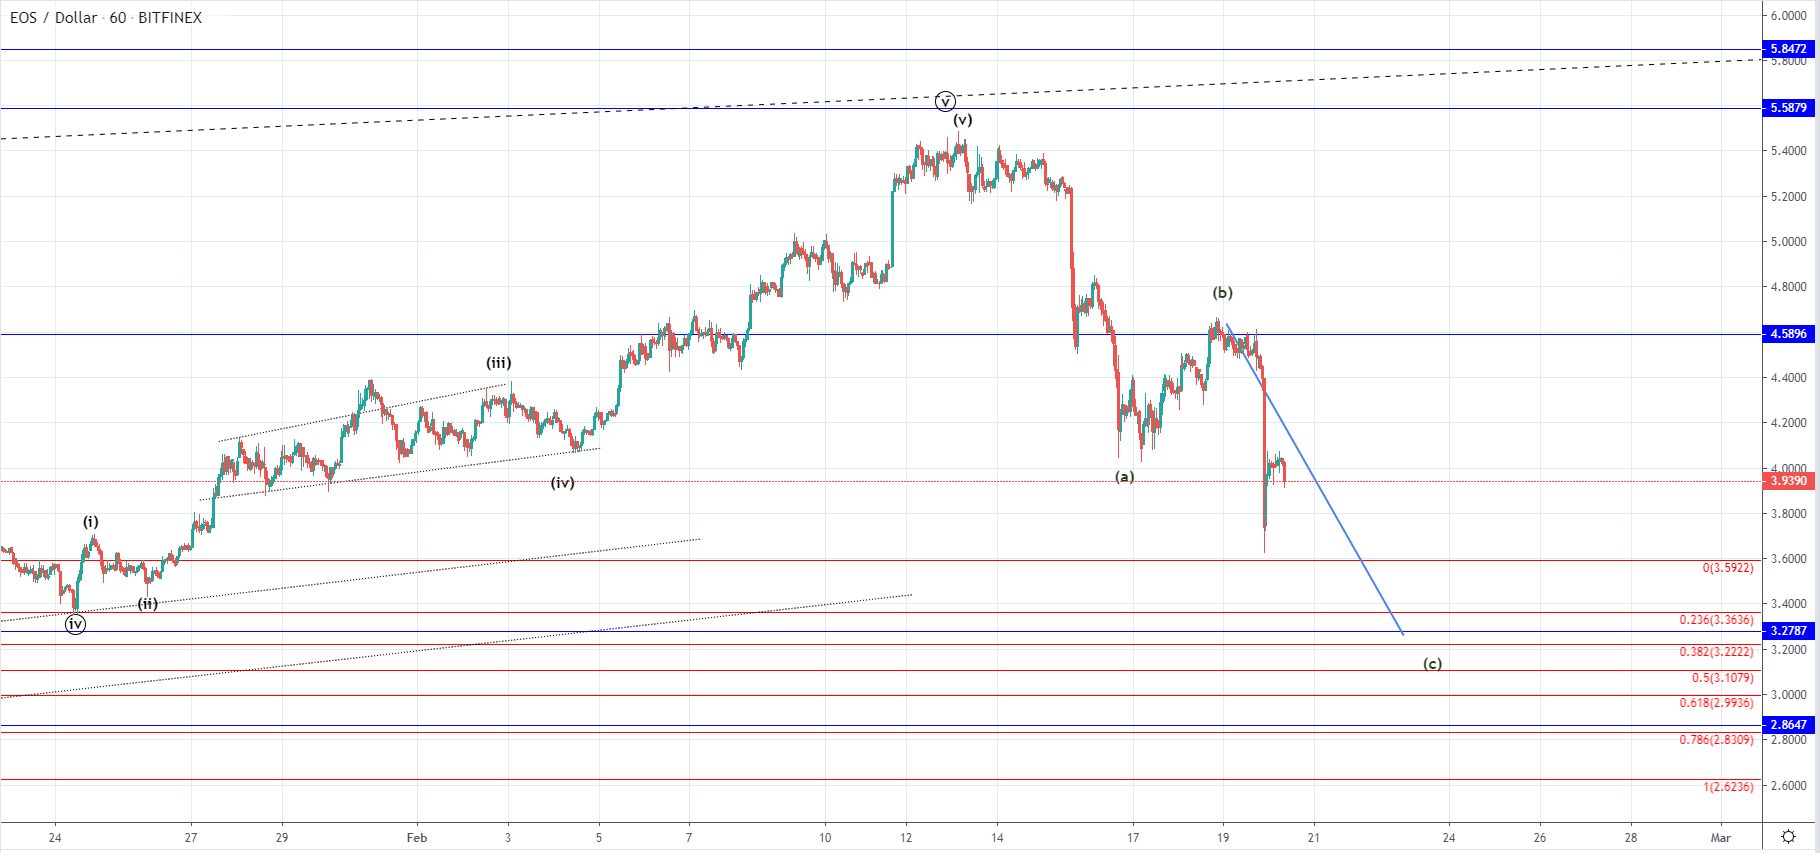
The price of EOS has decreased by 18.93% since yesterday’s high at around $4.6 as it came down to $3.724 and even spiked further down. Since then we have seen a slight recovery with the price managing to stay above the $4 mark.
On the hourly chart, we can see that the price like in the case of Litecoin found support at the lower ascending trendline vicinity and came just above the 0 Fib level before it found support. The recovery that followed hasn’t made any major gains and is struggling to keep the price above $4.
If we have seen the completion of the B wave from the ABC correction the C wave is in development which is why further downside movement could be expected. Projecting the length of the A wave on to the B wave we come up with a target at around $3.28 horizontal level which is a significant one so we might see it’s retest before the completion of this descending move.
This decrease is considered a corrective one so further uptrend continuation would be expected after but in the meantime, we are yet to see where it ends.