LTC and EOS - corrective retracement or downtrend continuation?
LTC/USD
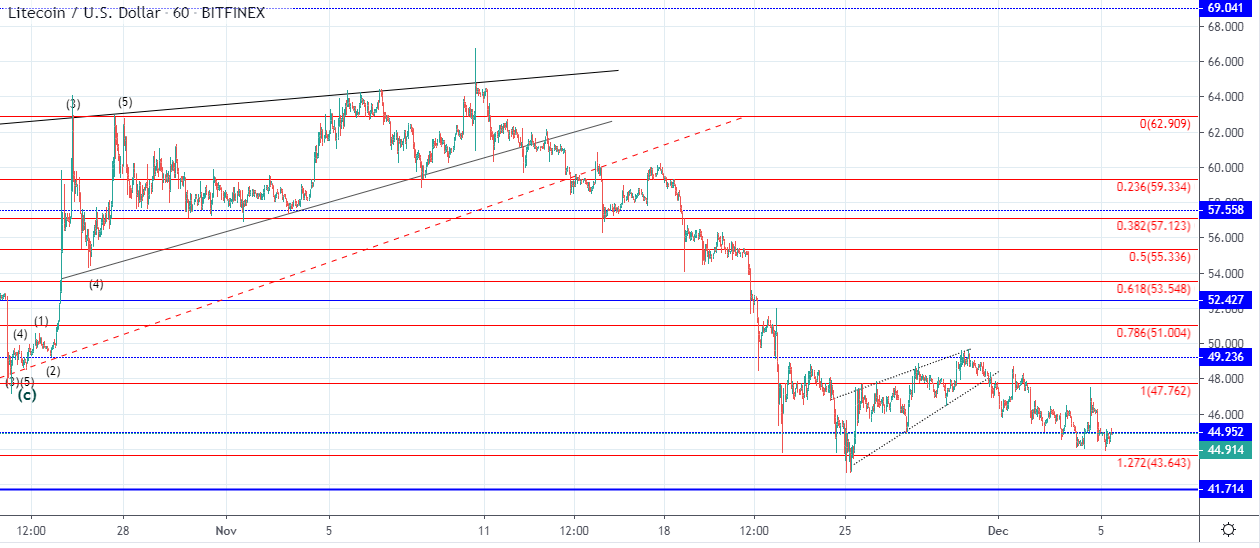
From Sunday when the price of Litecoin was sitting at $49.551 we have seen a decrease of 11.23% measured to its lowest point today at $43.898. The price is currently being traded at $44.914 and is retesting the horizontal support for resistance as you can see from the hourly chart below.
This price movement indicates that we are most likely seeing a corrective move to the downside after a breakout from the ascending triangle. The breakout momentum was strong which is why we could see the price continuing to form lower lows.
As the price is currently retesting the $44.952 horizontal level we are soon going to see if the resistance is there and if the interaction ends as a rejection further lows would looks highly likely. If the price however manages to go above the horizontal level and stays there it could be an early indication that the recovery has started with the ascending triangle being its first wave.
EOS/USD
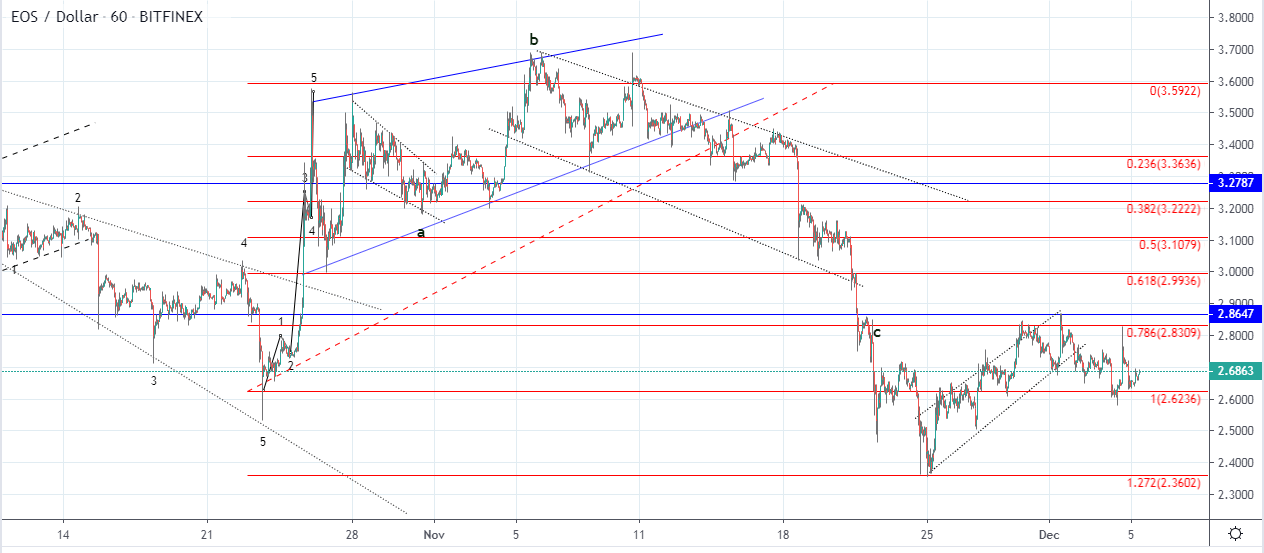
The price of EOS has also broken out from its ascending range but fell only by 7.36% from its highest point on Sunday at $2.81 to 2.61. Like in the case of Litecoin the price spiked to the upside yesterday coming to retest the 0.786 resistance level but shortly fell back to the levels from which the increase was made.
The price came down to the 1 Fibonacci level and found support there so if the increase continues without going below it, it could indicate further price appreciation. But if the price continues moving to the downside below the $2.62 level a retest of the 1.272 Fib level would look more likely with potential further lower lows.
In that case the ascending channel would have been corrective in nature and was not a leading diagonal which will be validated by the price depreciation above $2.36