LTC and EOS - Further lows are expected
LTC/USD
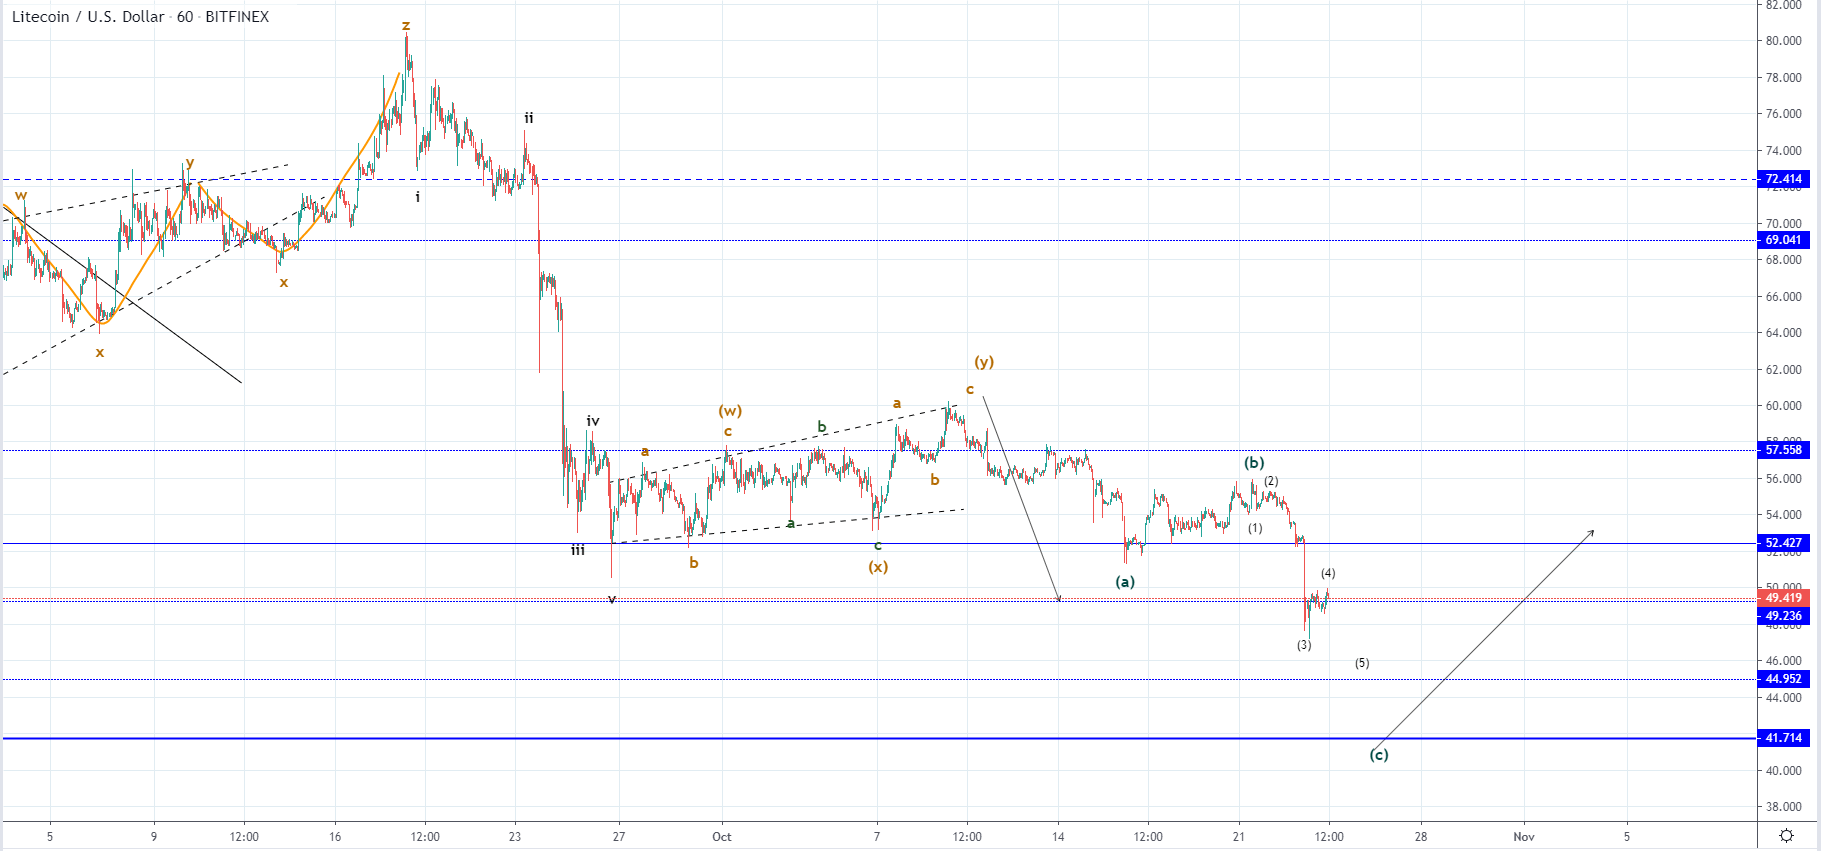
From Monday’s high at $55.776 the price of Litecoin has decreased by 15.34% measured to yesterday’s low at $47.218. Since then we have seen a minor recovery with the price currently being traded around $49.419.
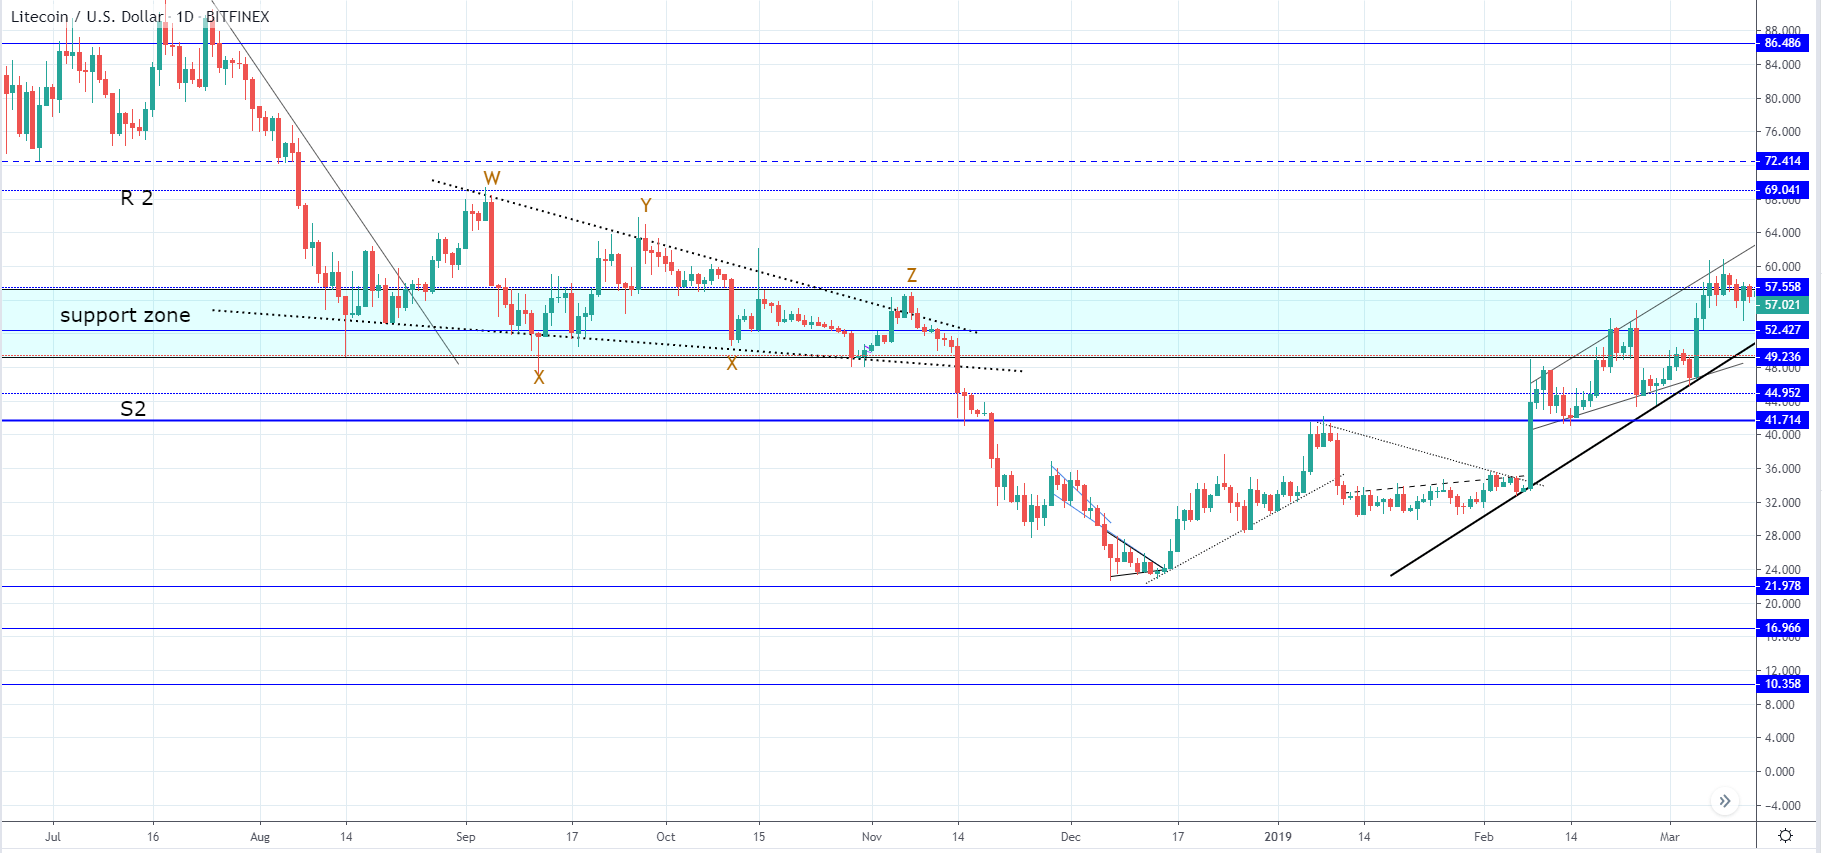
The next horizontal level in line to the downside is at $44.952 but a more significant one is at $41.714 with whom we are more likely to see interaction as the ending point of the current decline. This level was major resistance in the period of price consolidation between December 2018 and February 2019 and prior to that served as the last horizontal support level off of the support zone which you can see from the daily chart below.
Because we have seen a breakout to the upside above the level after the mentioned consolidation period it’s retest for support would be a normal thing in price progression. But if the price goes below the level again which we are yet to see from the momentum of the expected decline, we could see the price back to the December 2018 low or even establish lower once.
EOS/USD
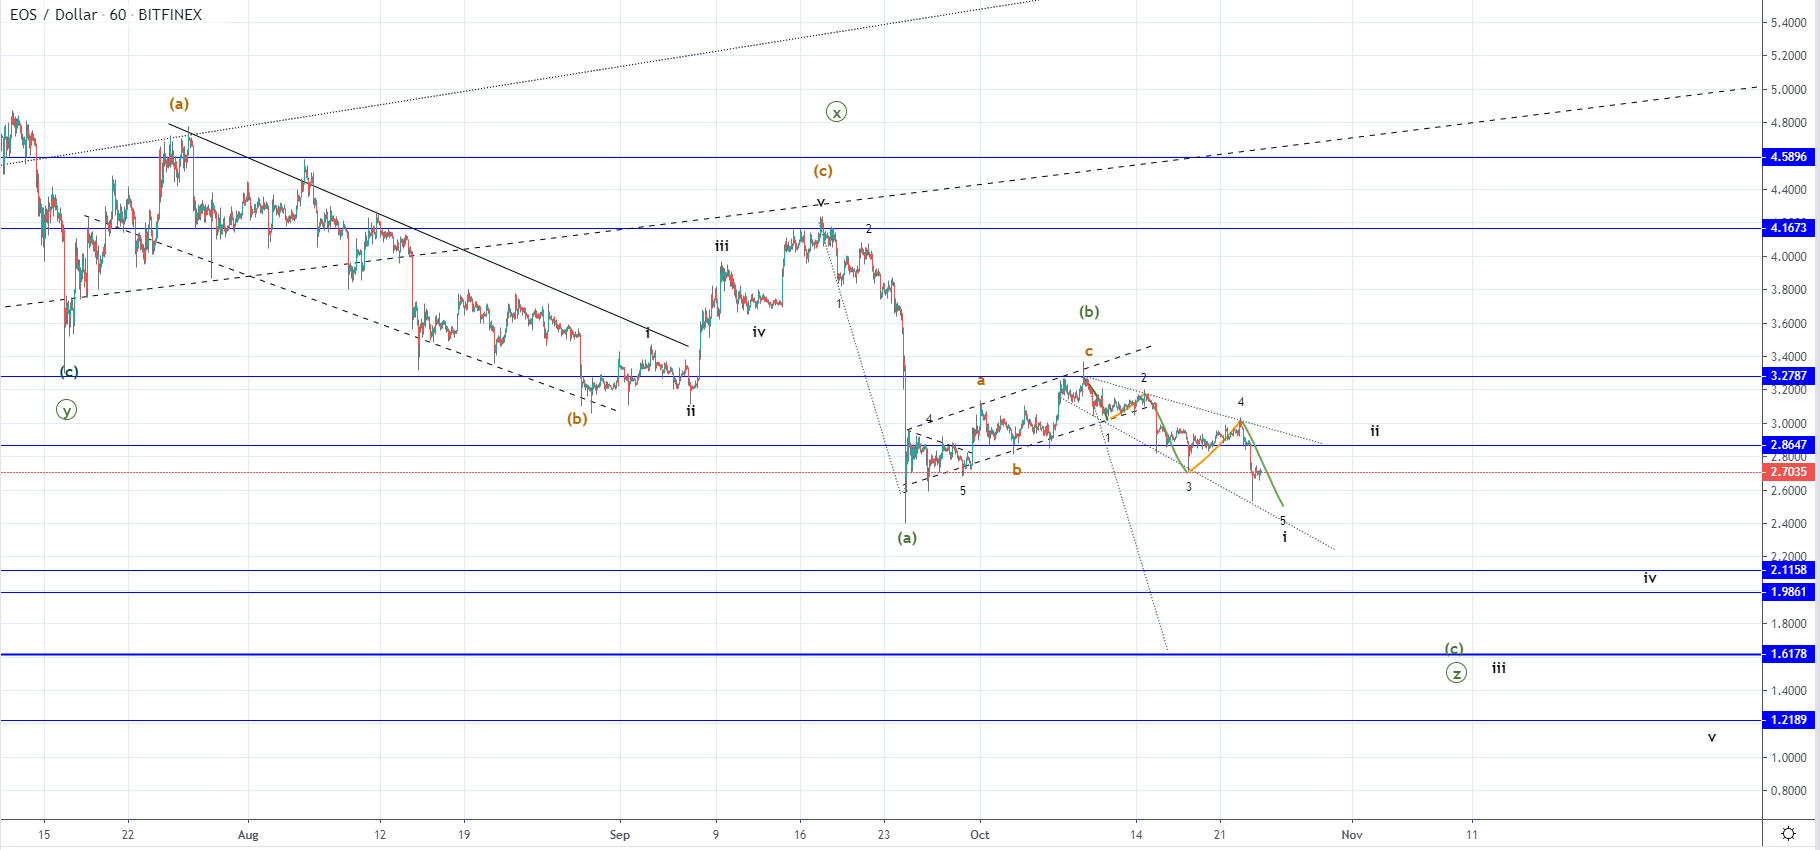
The price of EOS has decreased by 11.% from Monday’s high at $3 measured to today’s low at $2.6729 around which it is currently being traded. Looking at the hourly chart below you can see that the price was been decreasing in a five-wave manner from the rejection at the $3.2787 horizontal level and has formed a diagonal which could be the one of a leading kind which would be the first wave off of the higher degree five-wave move to the downside.
As previous to the formation of the descending channel, we have seen an ascending one which is considered a B wave the current move to the downside is labeled as a C wave which is expected to bring the price of EOS to some of the horizontal support levels below the one broken yesterday at $2.86.
The mentioned C wave would be the sub-wave of the Z wave from the higher degree five-wave move to the downside measured from the yearly high and would mark the end of the decline, but it is still unclear how will the Z wave develop. But we are seeing a leading diagonal the price could fall to $1.21 before the end of the decrease. However, if the price develops two more waves to the downside and ends its decline as a three-wave move the most optimal price target would be at the $1.6178 which would be a retest of the December’s low.