LTC and EOS - further recovery expected before the downtrend continues
LTC/USD
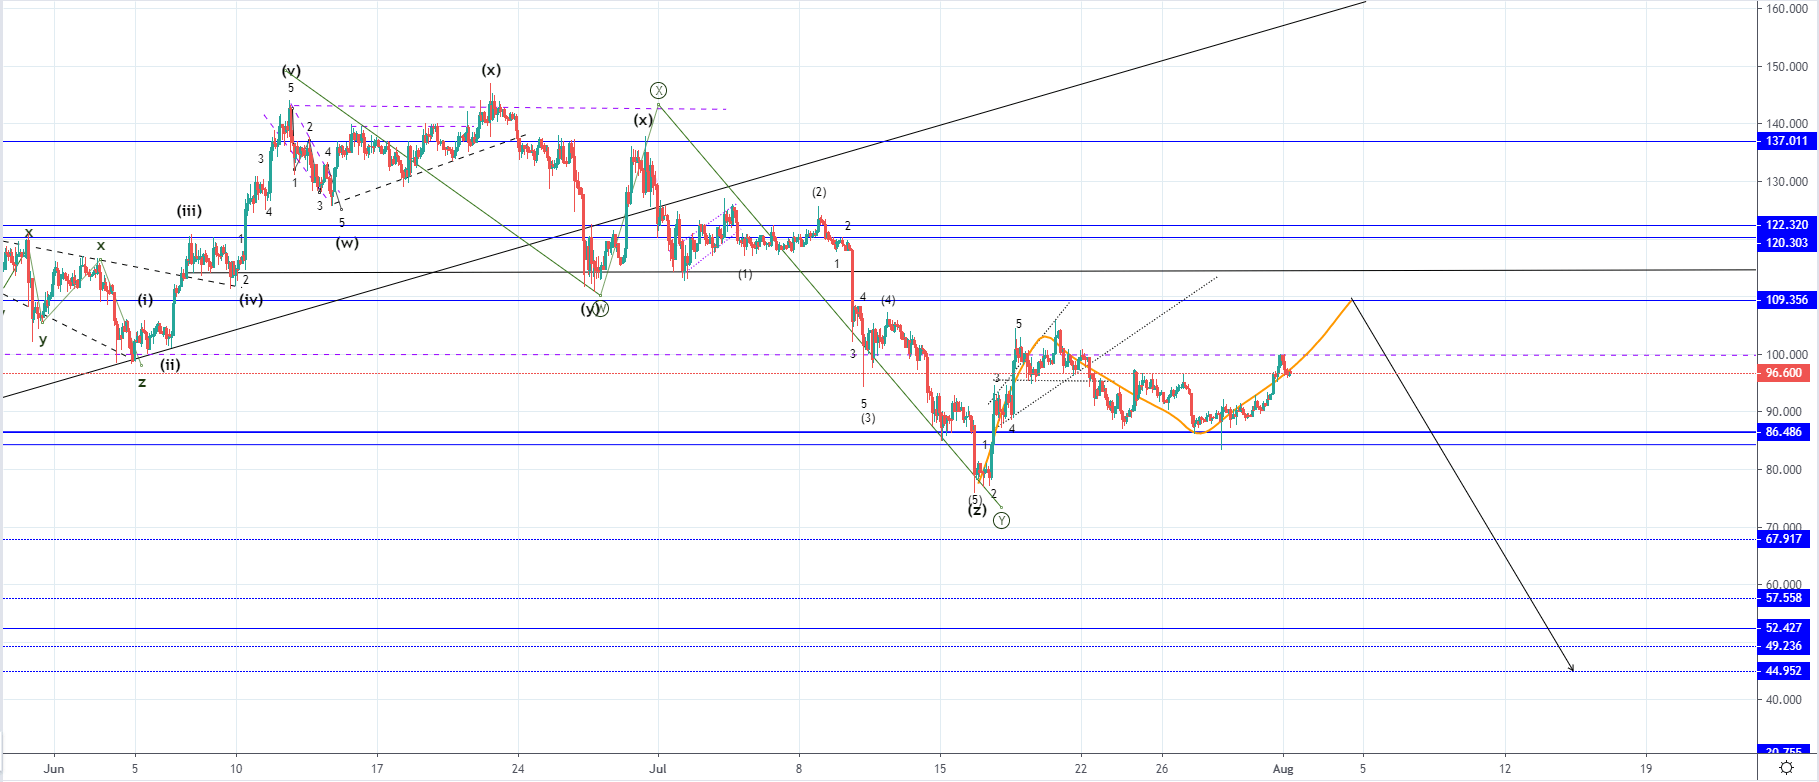
From Monday’s low at $88.63, the price of Litecoin has increased by 12.64% measured to its highest point today at $99.837.On the hourly chart below, you can see that the price of Litecoin found resistance at the minor horizontal level and has got rejected which is why the price has started decreasing and is currently being traded at $96.6.
This 3rd wave is likely to end as a retest of the broken horizontal support level at $109.356 which is the lower level from the resistance zone of a higher degree and is expected to end as another rejection. As we’ve seen the end of the complex correction which is a three-wave one on a higher degree this current upside structure is considered to be the 2nd wave out of an even higher degree move to the downside and is why I would be expecting further downside for the price of Litecoin in the upcoming period.
In either way, the price of Litecoin is expected to go above today’s high so depending on the momentum and strength of the expected upward move we are to reevaluate the possibility of another increase as we could be seeing the start of another five-wave move after the complex correction ended.
EOS/USD
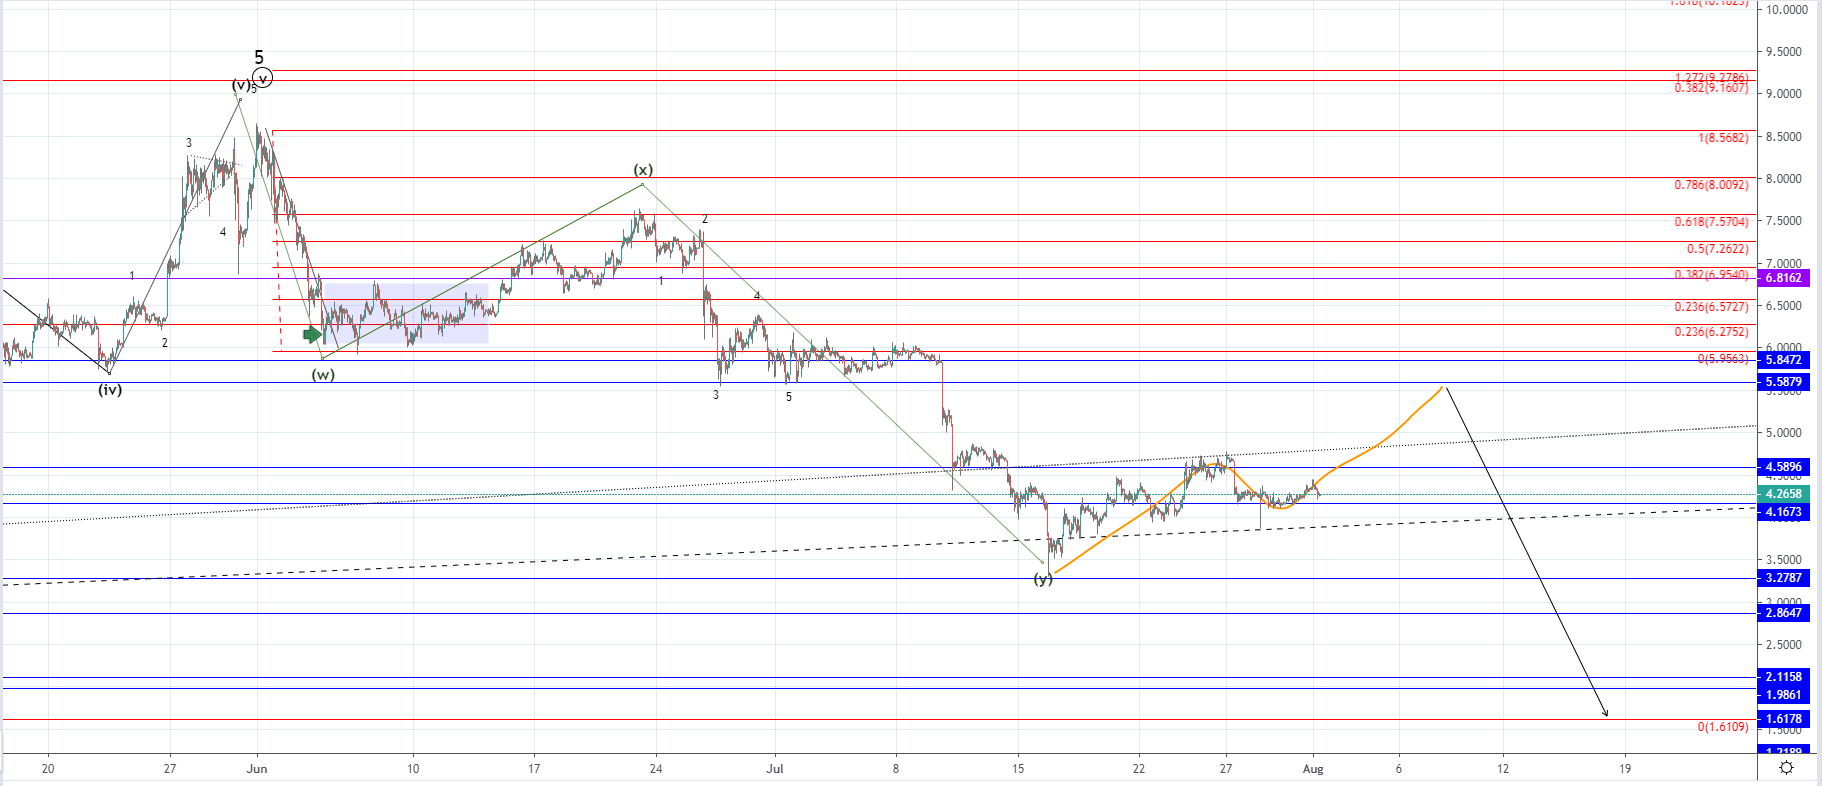
The price of EOS has been moving sideways since Friday 19th of July when it managed to go back up above $4.167 horizontal support level around which the price is currently being traded.
This corrective increase could bring the price of EOS to $5.58 which would be a retest of the broken horizontal support level before another downturn starts and is likely to end as a three-wave structure. With the price moving sideways I think we’ve seen the completion of the 2nd wave which is why soon another increase would be expected considering weak momentum seen I don’t believe that the increase would be that significant.
More likely we are to see the interaction with the $5.56 level ending as rejection after which the price is to continue moving to the downside to some of the significant horizontal support levels out of which the most relevant one would be at the 0 Fib line at $1.6 but the decrease could stop slightly above as there are multiple support points in between. If this plays out like projected it would most likely mean that we have seen the WXY correction prolonged by two more waves X and Z and after its completion, I would be expecting a significant recovery.