LTC and EOS moving sideways but for how long?
LTC/USD
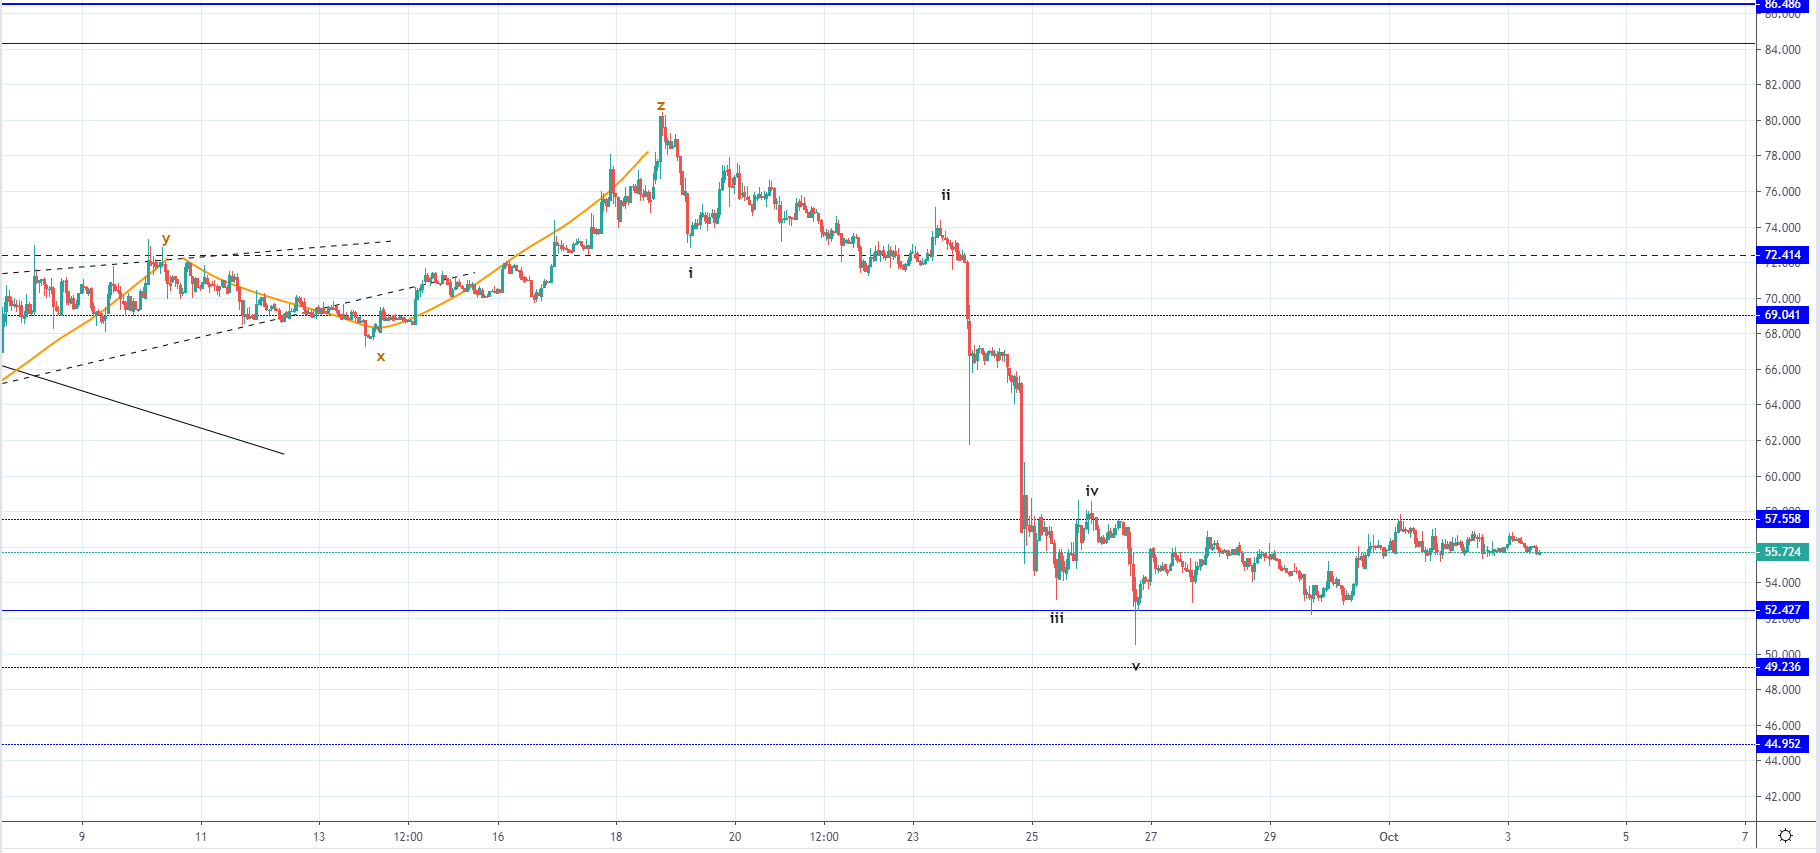
From Monday’s open at $54.64 the price of Litecoin has increased by 5.34% at its highest point of the week made on Tuesday when the price retested the $57.558 level which was broken on the way down. Currently, the price is being traded slightly lower at around $55.72 as it was mostly been moving sideways since the start of the week.
The next move that is likely to play out could be the start of a recovery as the price fell down to the significant horizontal level and found support there but since the bearish momentum was strong this could be interpreted as consolidation before the further downfall. If the price manages to increase above the $57.55 level and stays above it, the likelihood of the recovery commencing would increase but if the price gets rejected at the current retest and starts moving below the $52.42 level the possibility of the downtrend continuation would look more likely.
EOS/USD
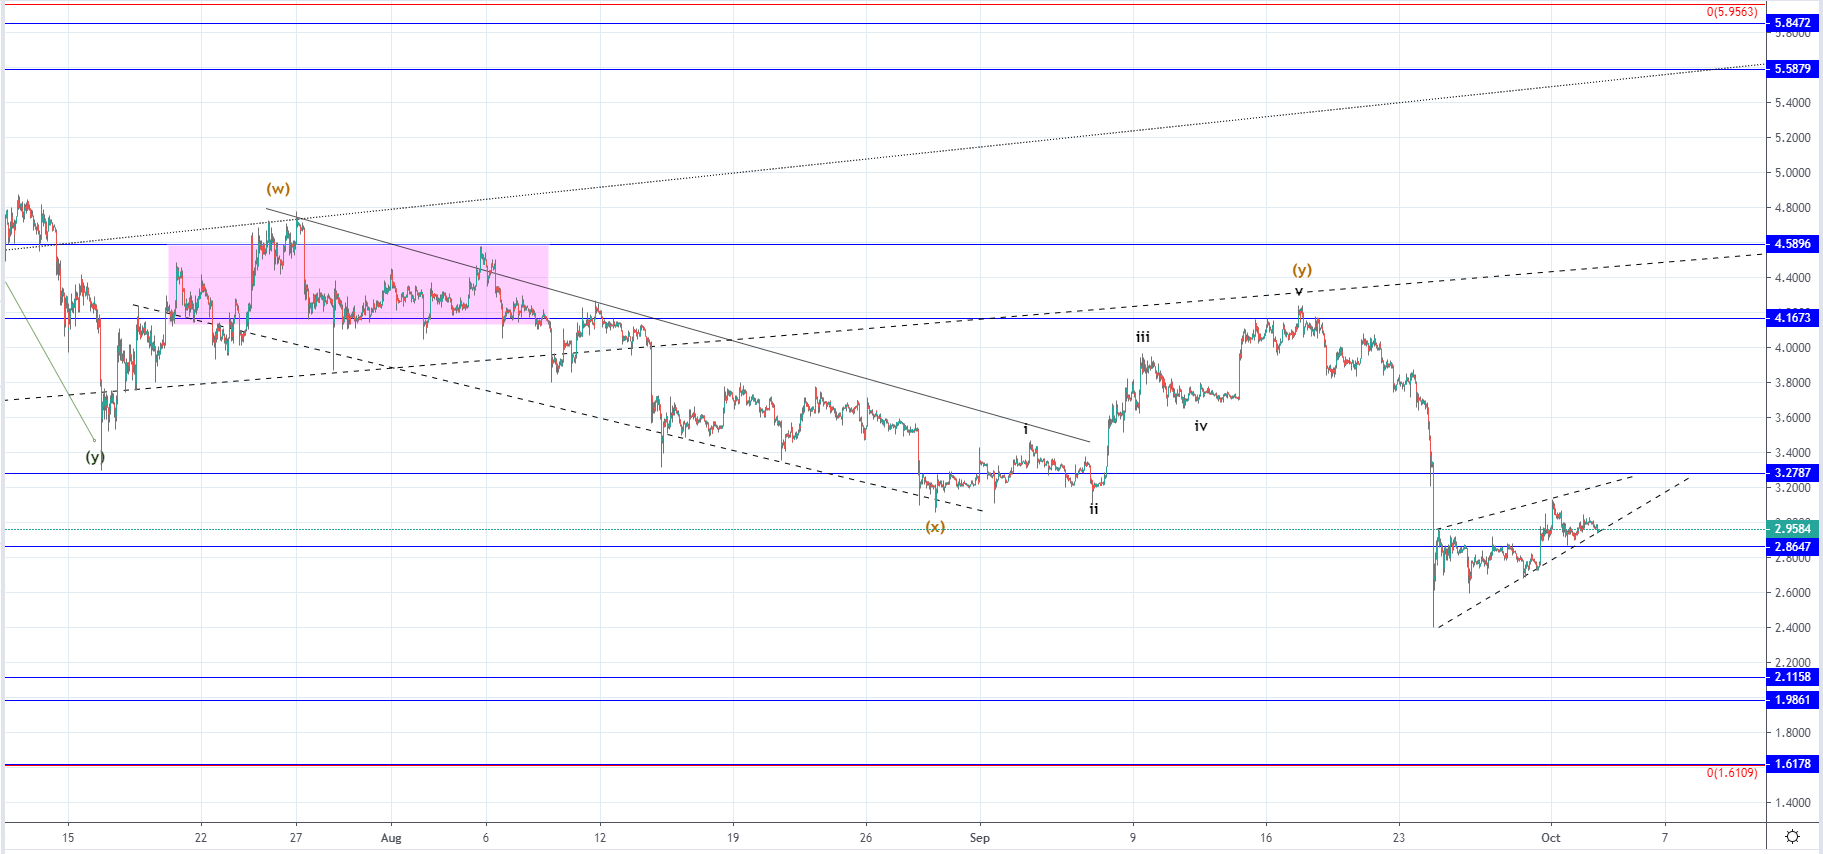
The price of EOS has increased from Monday’s low at $2.7336 to $3.1335 on the next day which was an increase of 14.73% but from there decreased again and is currently being traded at $2.9584.
The price is currently retesting the $2.86 level for support as well as the ascending support level from the still unconfirmed triangle which is why if the price finds support there we are to see further increase. But if the price falls below the $2.86 level it would mean that a minor breakout has been made with the price likely continuing its downside trajectory. If we have seen the completion of the WXY to the upside from the 16th of July till the 17th of September the downside move that played out could be the first wave out of the next downtrend move with the ascending triangle being its second which means that a third would start developing soon to the downside.