LTC and EOS - Recovery seen but it could be still a corrective one
LTC/USD
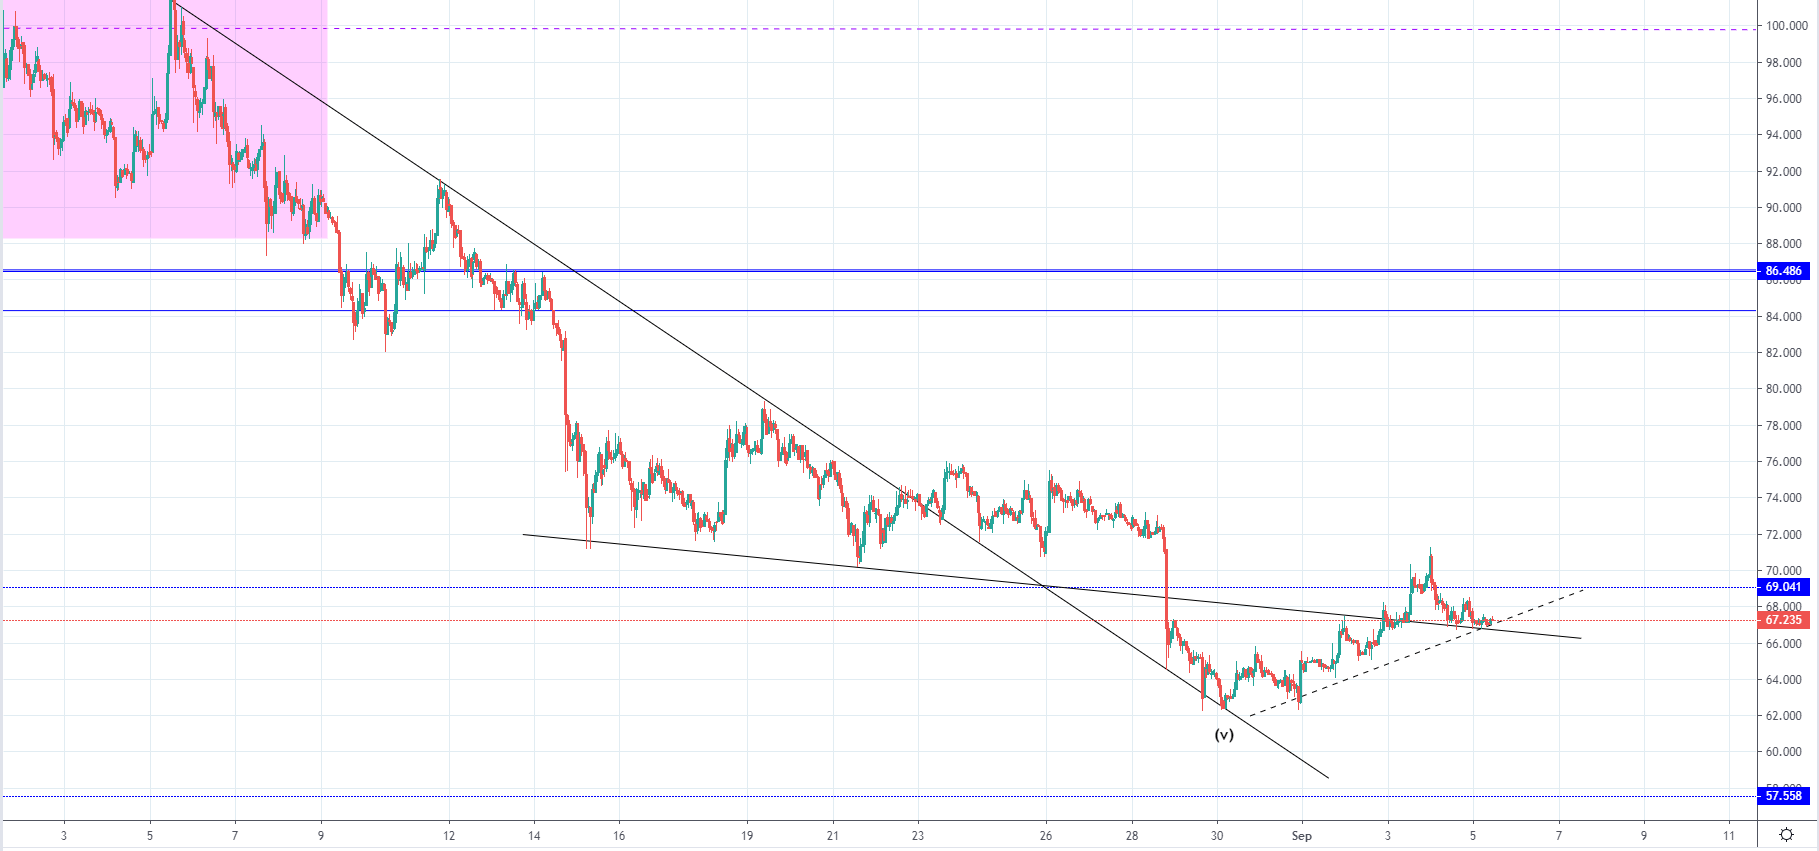
From last Friday when the price of Litecoin has been sitting around $62.332 at its lowest point we have seen an increase of 13.61% until Tuesday when it came up to $70.8 at its highest point but is currently sitting at $67 as a minor retracement occurred.
If we’ve seen the ending wave from the five-wave move to the downside the recovery which started could lead to a significant one as the price of Litecoin decreased by over 56% from its yearly high. But if the five-wave decrease hasn’t ended this recovery could only be a minor one before the downtrend continuation. This is why the $69 level is serving as a pivot point above which it is considered as the seller’s territory so if the price manages to move back above it and stays there the likelihood of a significant recovery would be higher.
If however the price gets rejected here and starts moving impulsively to the downside again the likelihood of the downside movement continuing would be higher.
EOS/USD
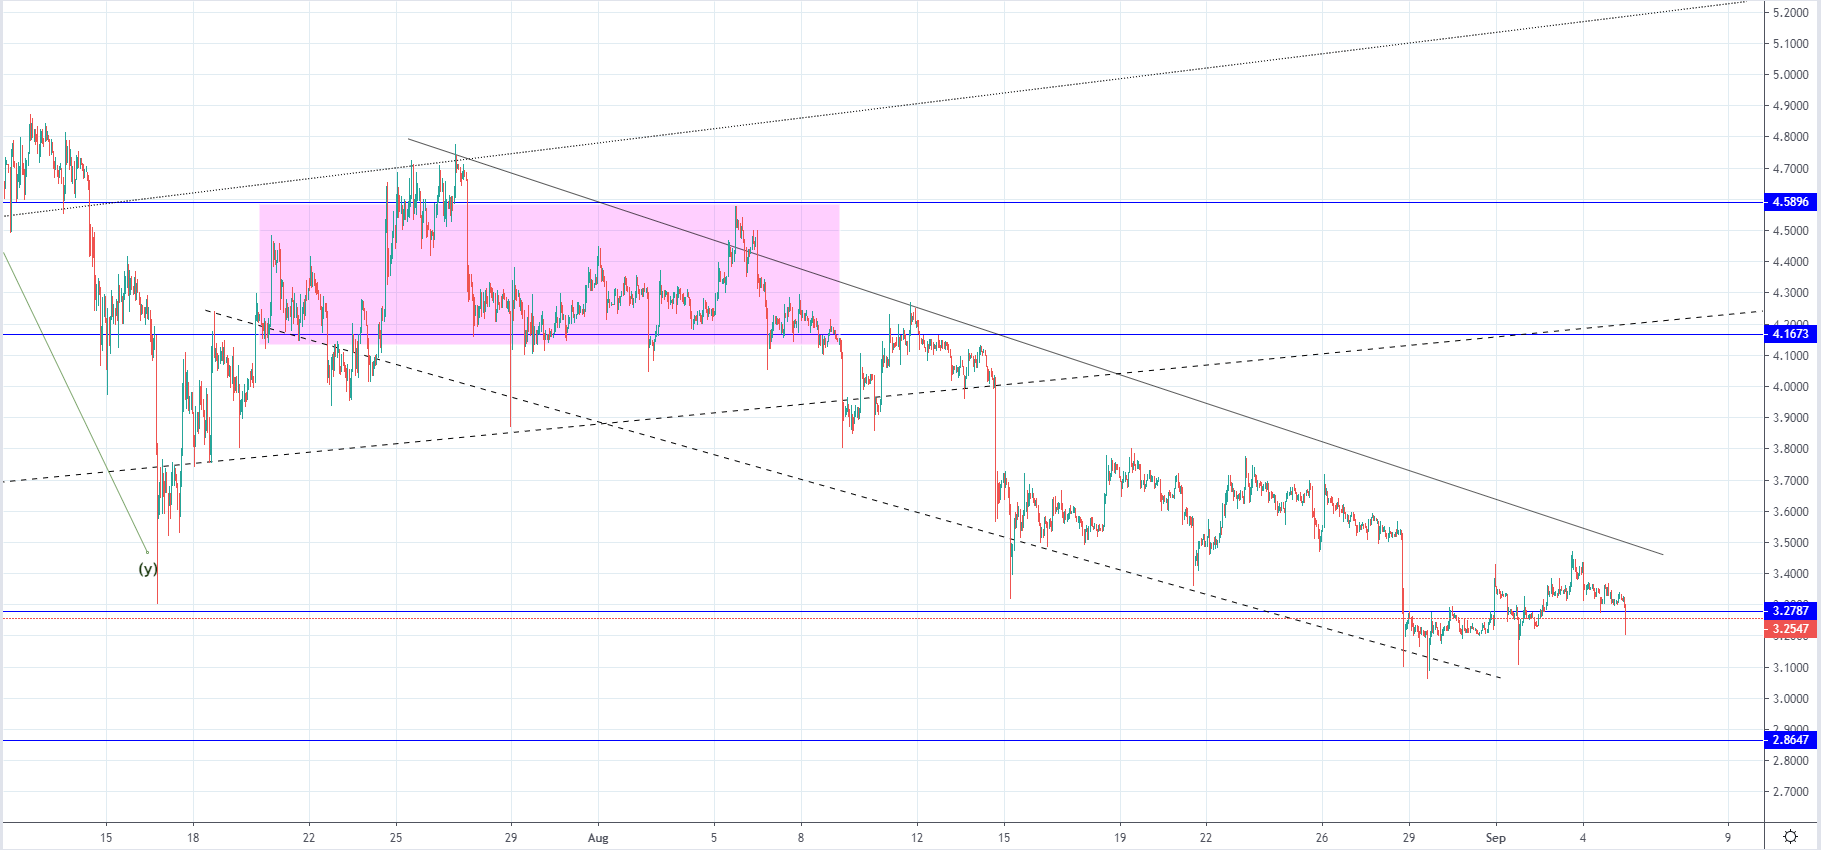
From last Thursday when the price of EOS was sitting at around $3 at its lowest point we’ve seen a recovery of 12.3% until Tuesday this week when the price came up $3.45 at its highest. The price is currently being traded at around $3.27 as a minor retracement occurred to the horizontal support level which was broken on the way down.
If the price doesn’t find support and starts moving to the downside again the next potential target for the expected decrease would be the lower horizontal support level at $2.86.