LTC and EOS - Recovery soon expected but decline is yet to end
LTC/USD
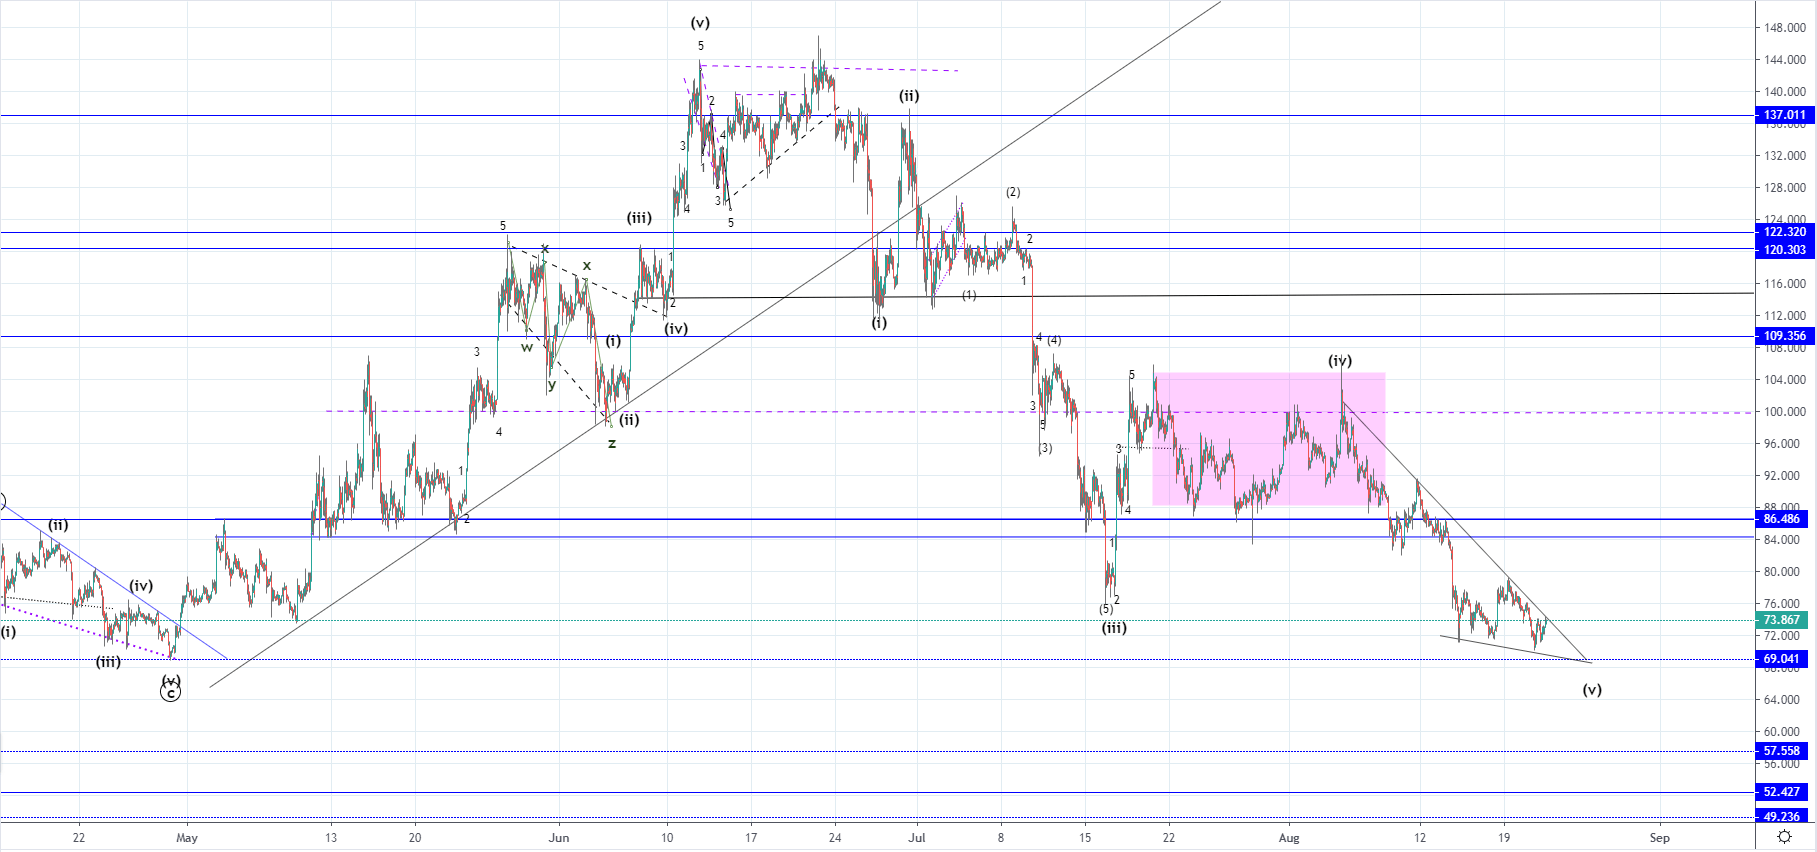
Last Thursday the price of Litecoin was sitting at its lowest levels the price has been since 29th of April as it was $71.1 but from there started recovering until Monday when it came up to $78.87 at its highest. From Monday we’ve seen another decrease with the price making a slightly lower low compared to the last week’s one but is currently sitting at $73.867.
This interaction would be expected to end as a test of the level for support and considering that the wave structure implies that we are seeing the ending wave out of the last downside move this is likely to end as a bounce from the horizontal level with the price action forming an ending diagonal. Especially considering the amount of the seen decrease it appears that the downfall should shortly end which is why the horizontal level would serve as an indication point from which a recovery could be triggered.
If the price finds support recovery to the upside would be expected potentially all the way up to $109.356 or at least to the $86 area where the significant horizontal support zone was broken. But if the price continues decreasing past the level interaction with the next one would look more likely which would be at around $57.5.
EOS/USD
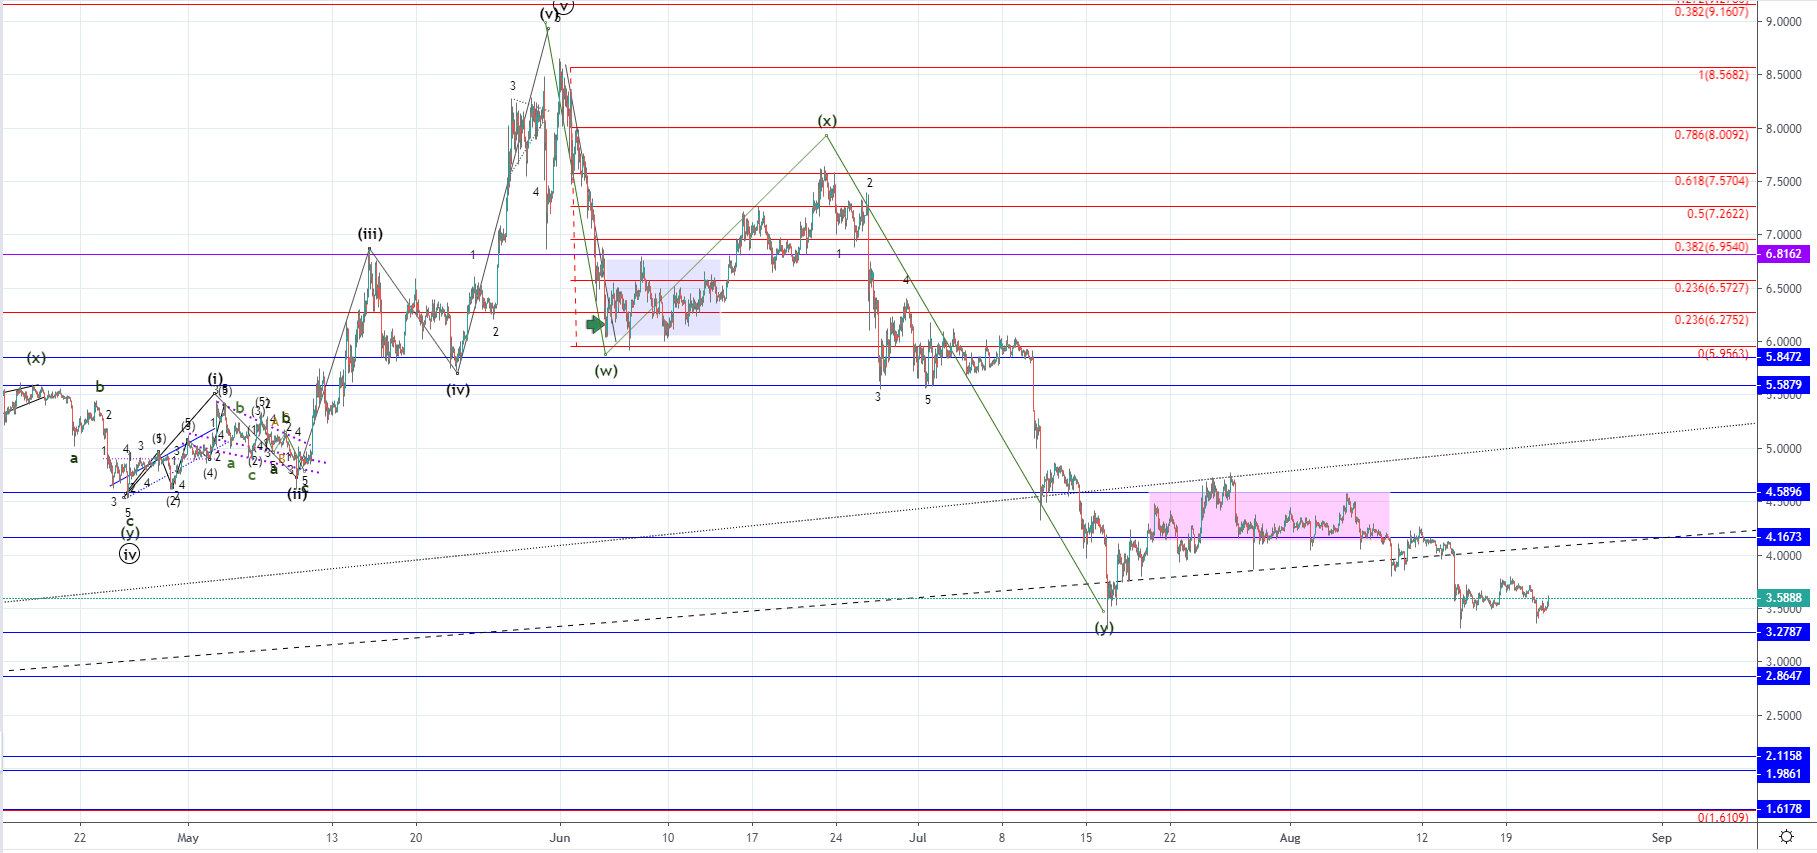
Last week on Thursday the price of EOS was sitting at $3.31 at its lowest spike from where we’ve seen a 14% recovery until Monday when the price reached $3.78 at its highest. But from Monday we have seen another downtrend developing with the price moving back to the last week’s low vicinity above which it is currently being traded at $3.588.
As we’ve seen a decrease of 10.1% from Monday’s high the recovery might start but the wave structure is implying that in either way another lower low should be expected before the start of a meaningful recovery. If the WXY correction got prolonged by two more waves, the horizontal range would have been the second wave X while the downside move seen after as a breakout is the Z wave. This means that recovery is to soon be expected but there aren’t any signs of a reversal coming soon which is why another low would look more likely. If the price continues moving to the downside the next price target for the ending point of the Z wave could be around $2.86 level, while we could see an even further decline to $2 area.