LTC and EOS - Sideways movement seen but another increase expected
LTC/USD
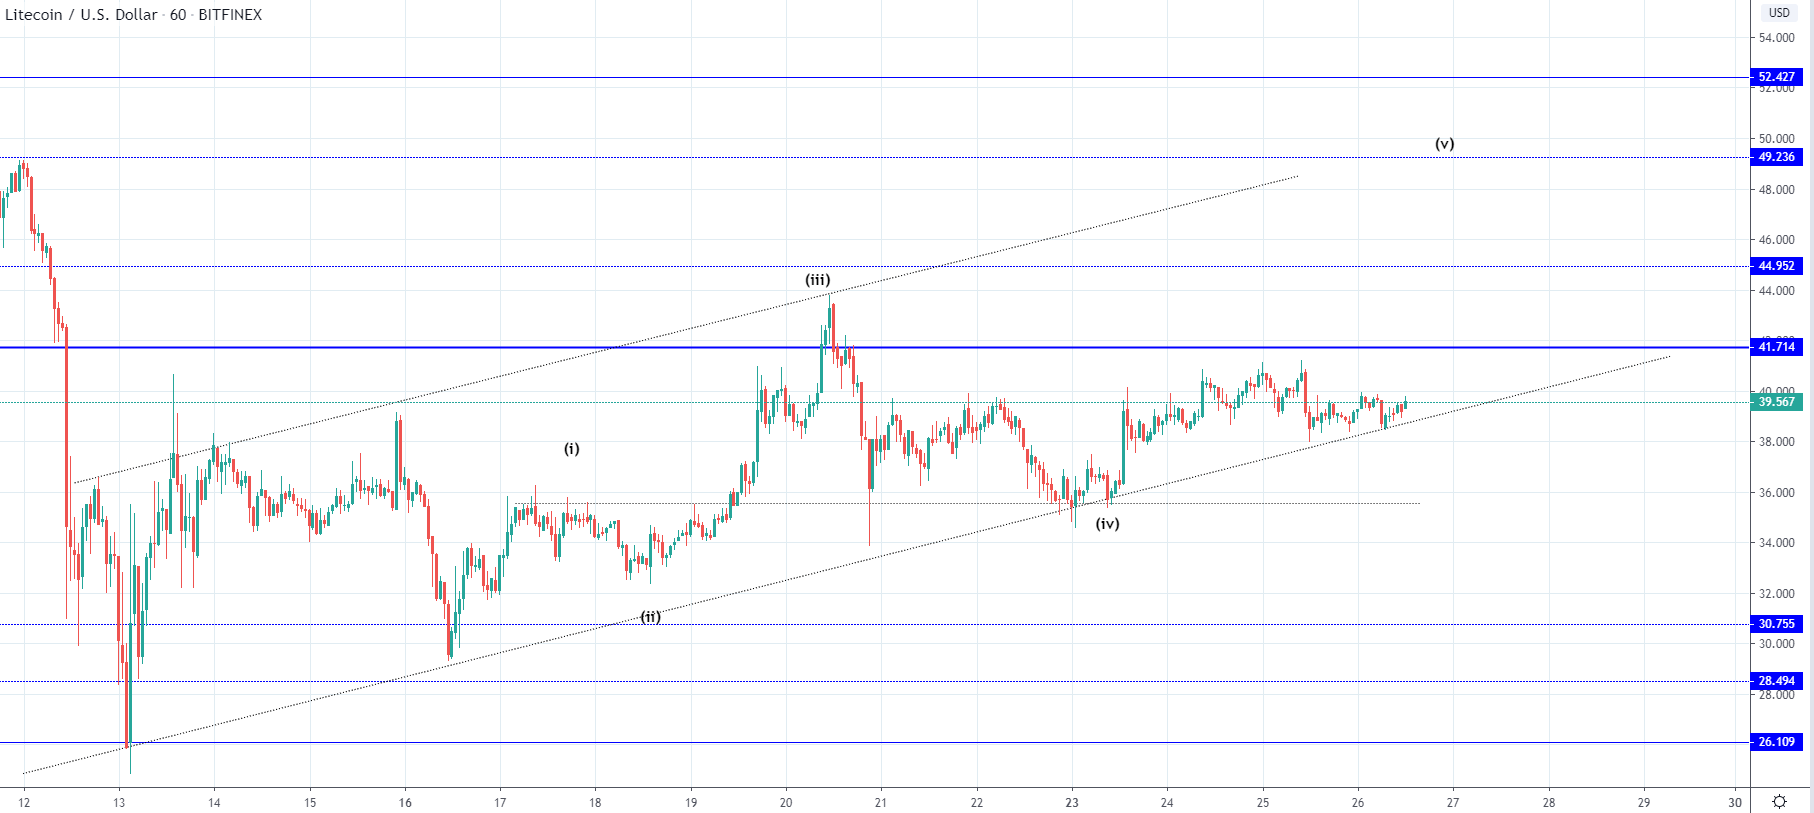
From Monday’s open at $35.4 the price of Litecoin has increased by 14.85% measured to its highest point this week at $40.7 made yesterday. Since yesterday’s high the price has started falling back and has made a minor retracement currently sitting at $39.56 and is moving sideways.
On the hourly chart, you can see that the price is currently testing the ascending support level from the 13th of March which has served as a baseline trendline and is the lower level from the ascending channel that has been formed. This ascending structure is most likely a corrective one which started to bring the price into recovery after a steep downfall to the $26.1 level.
As you can see the price has moved inside the boundaries of the ascending channel and considering that it’s currently sitting on its support level we can assume that now another increase could be expected. This is especially likely considering that the wave structure implies we are yet to see the 5th wave out of the five-wave impulse to the upside as the 4th wave tested the 1st wave’s ending point and managed to stay above it, validating the count.
The $41.7 horizontal resistance is a significant level that served as strong support and is now serving as a strong resistance which was confirmed but an interaction made last Friday on the 20th when it’s retest ended as a hard rejection that pushed the price into 15.19% decrease. That’s why the 5th wave could end as a truncation barely coming to the vicinity of the prior high but in theory we can see interaction with the upper horizontal resistance level at around $49 which could correlate with the ascending channel’s resistance level being retested again before the completion of this five-wave pattern.
EOS/USD
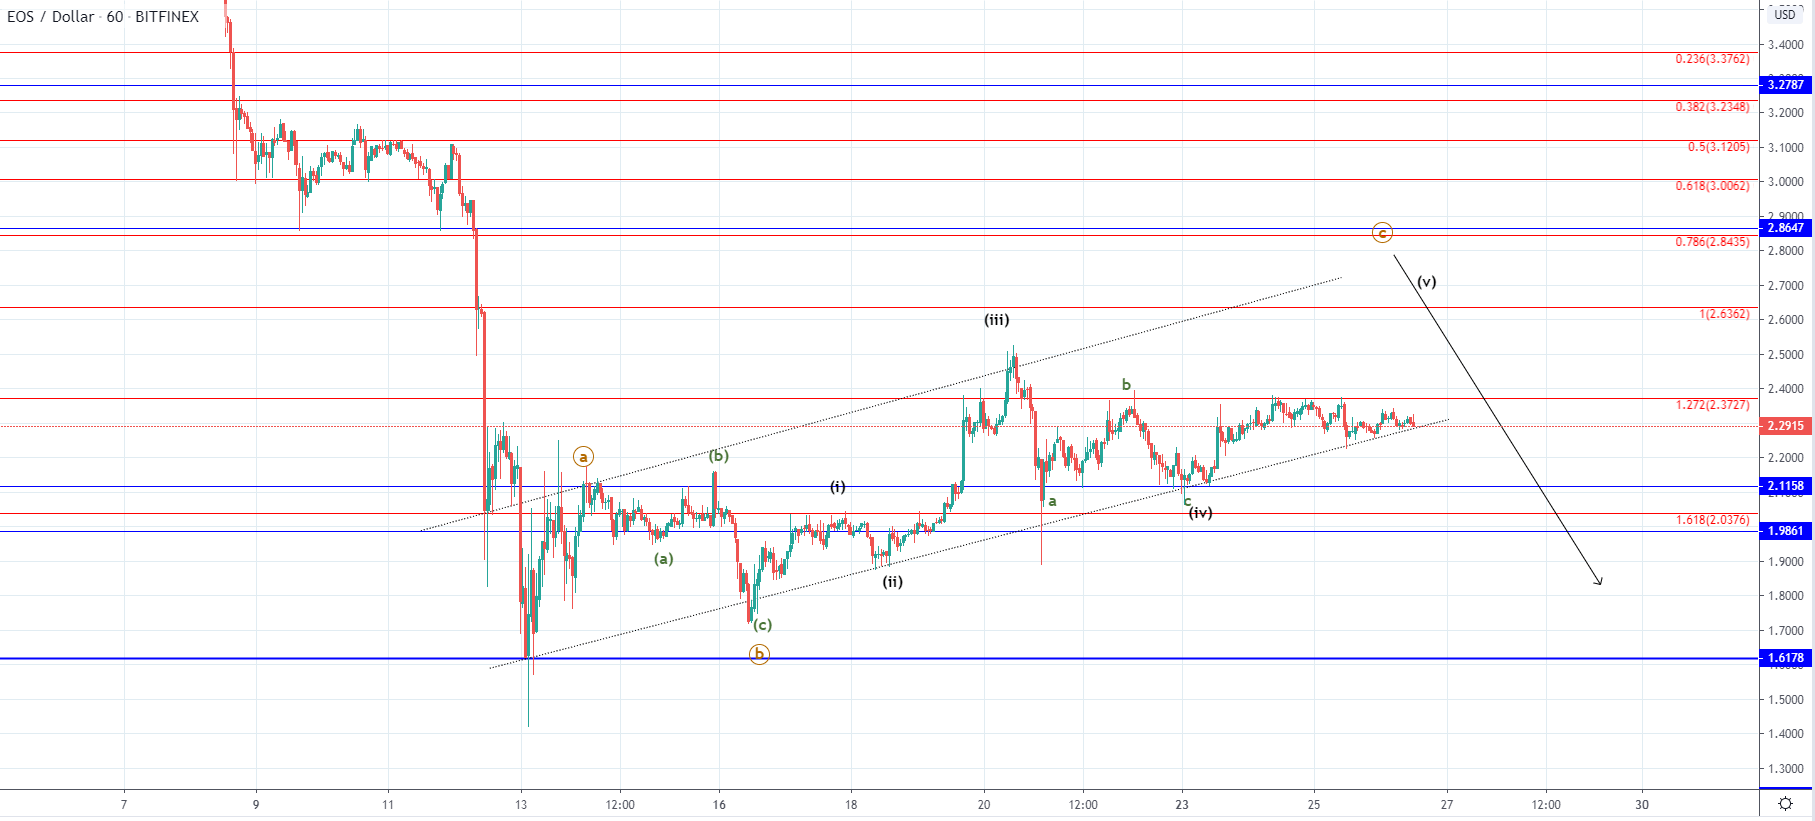
The price of EOS has been moving in a similar manner like the price of Litecoin in the last couple of days as after an interaction with its significant horizontal level has been seen with whom an interaction has lead into a sideways movement.