LTC and EOS - Starting impulse or a C wave?
LTC/USD
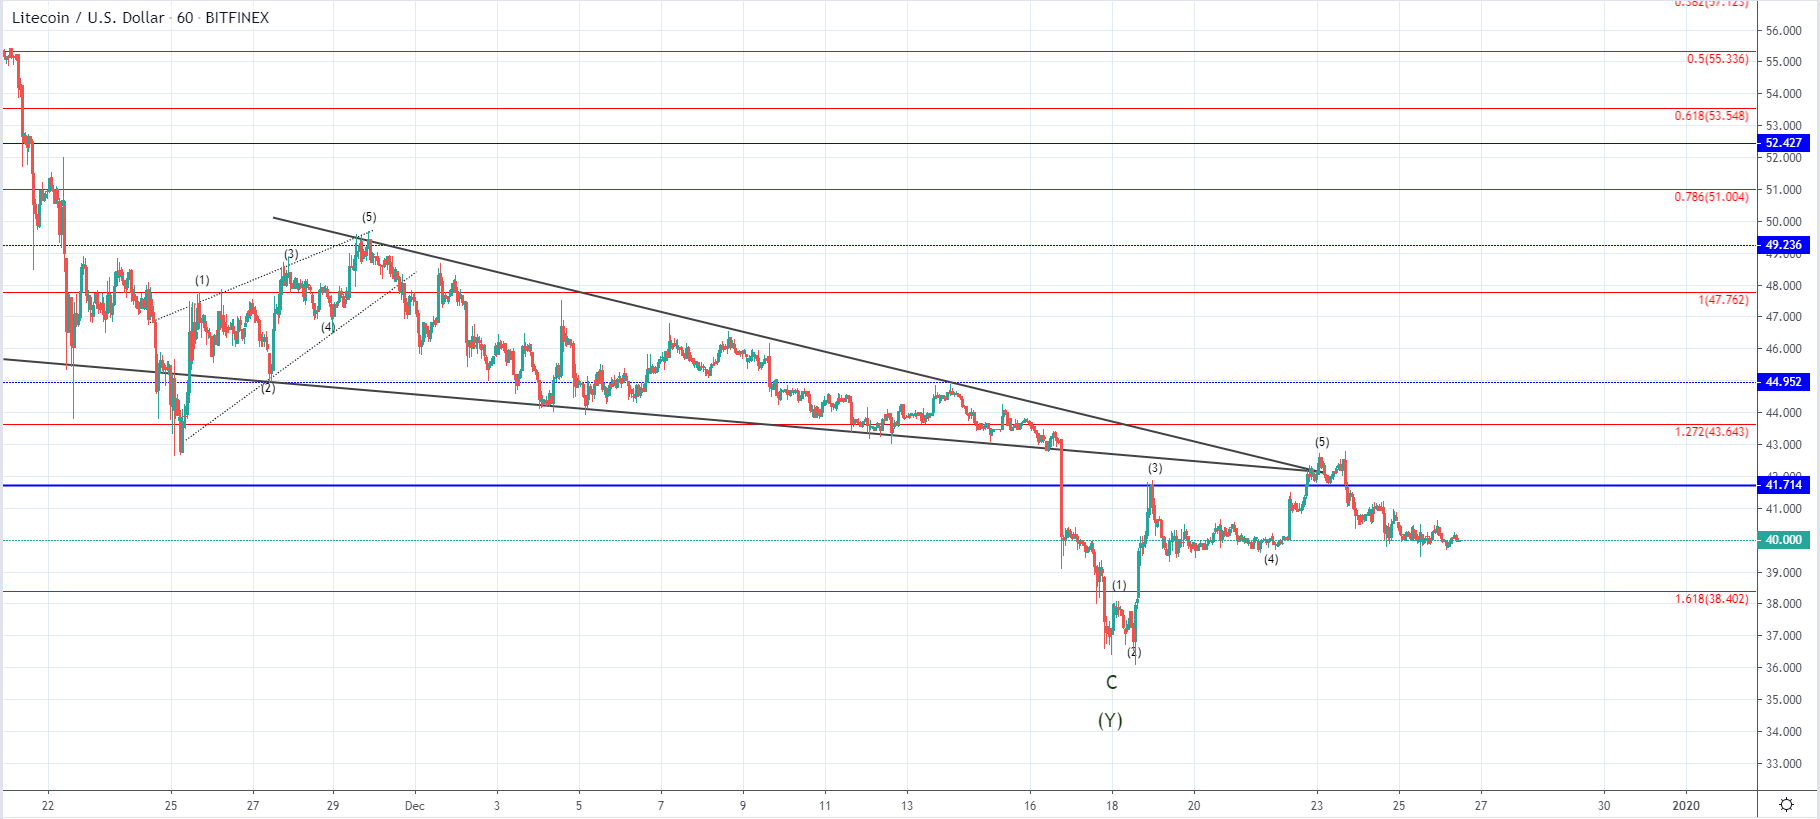
From last Wednesday when the price of Litecoin fell to $36.79 at its lowest point, measured to Monday’s high at $42.56 we have seen an increase of 15.68%. Since Monday’s high the price has been in a downward trajectory and is currently being traded around its lowest of the week which is at around $40.
This could be a minor retracement before the next wave to the upside starts, considering that we have seen a five-wave increase. But considering that the price broke out from the descending triangle and formed another five-wave move to the upside we could have seen the C wave out of the ABC to the upside with the prior ascending triangle being its A wave.
From the depth of the current retracement and the momentum of the next move to the upside, we are going to evaluate these possibilities.
EOS/USD
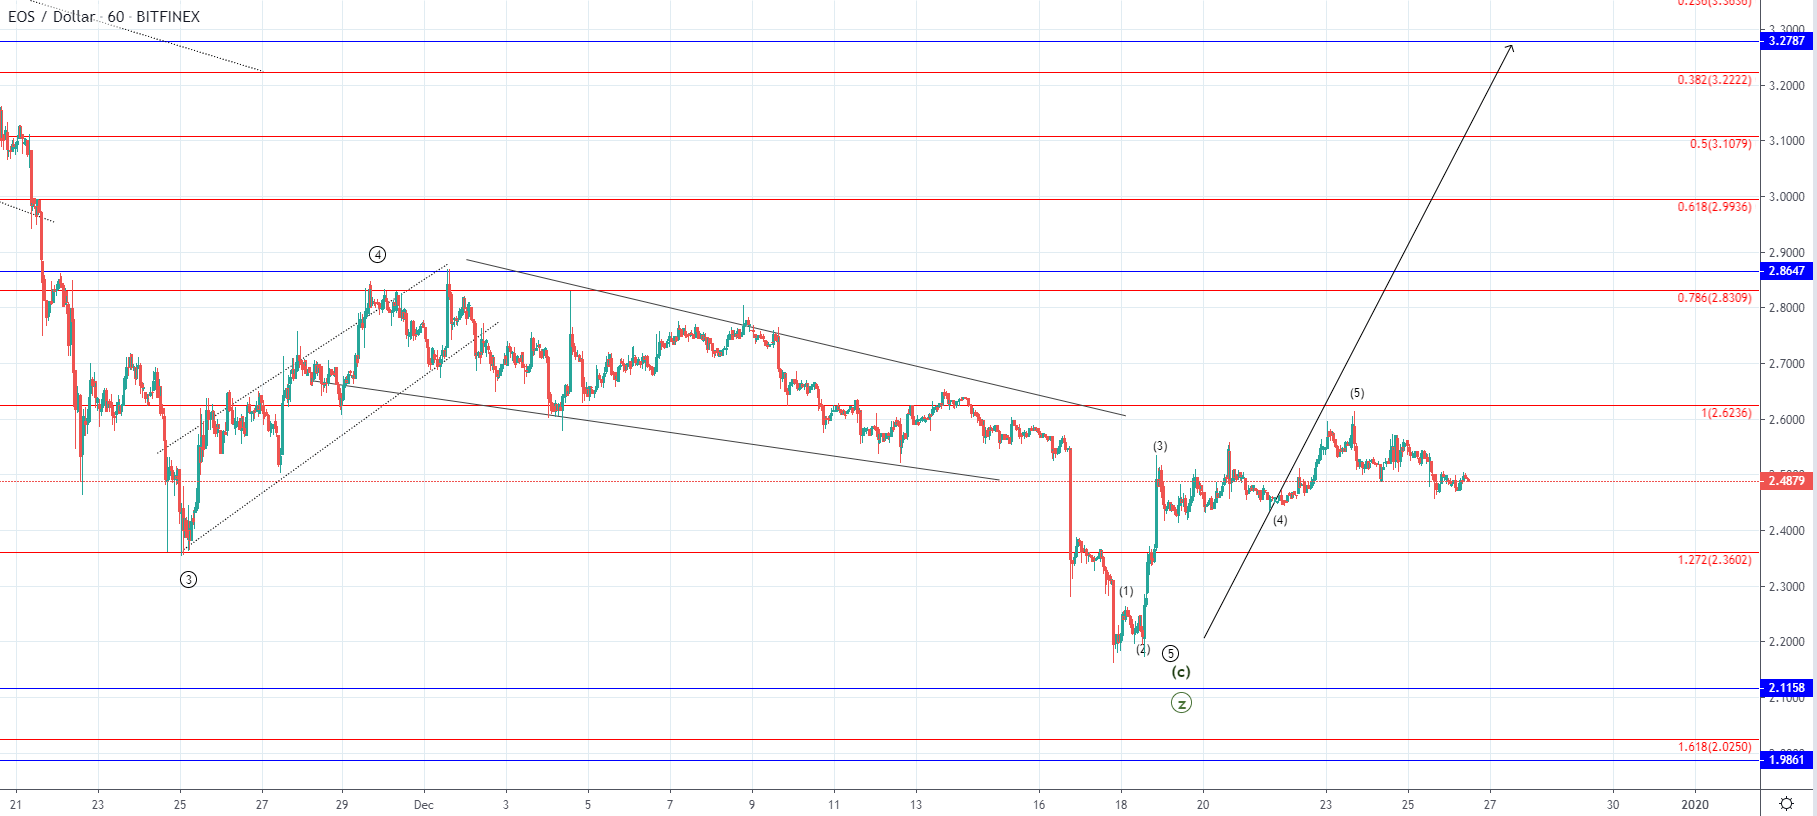
Like in the case of Litecoin, the price of EOS has recovered significantly from last Wednesday when it was sitting at $2.19 at its lowest point, coming to $2.6 at its highest on Monday this week which was an increase of 18.6%. Currently, the price is being traded at around $2.49 as it was in a downward trajectory since the start of the week.
As you can see by looking at the hourly chart, I was expecting this spike to the upside but as the beginning of the larger recovery. A five-wave move to the upside developed which could be the 1st sub-wave of the higher degree impulse wave. If this is true then the decline seen from Monday is its 2nd wave developing which can push the price all the way back to the prior low although unlikely.
More likely we are to see a retest of the prior higher low at 1.272 Fib level before further uptrend continuation if this is a starting impulse. If the price, however, goes below the 1.272 Fibonacci level it will indicate that the spike seen from last Wednesday till Monday this week could have been the C wave out of the ABC to the upside with further lows ahead.