LTC and EOS stuck in a horizontal range
LTC/USD
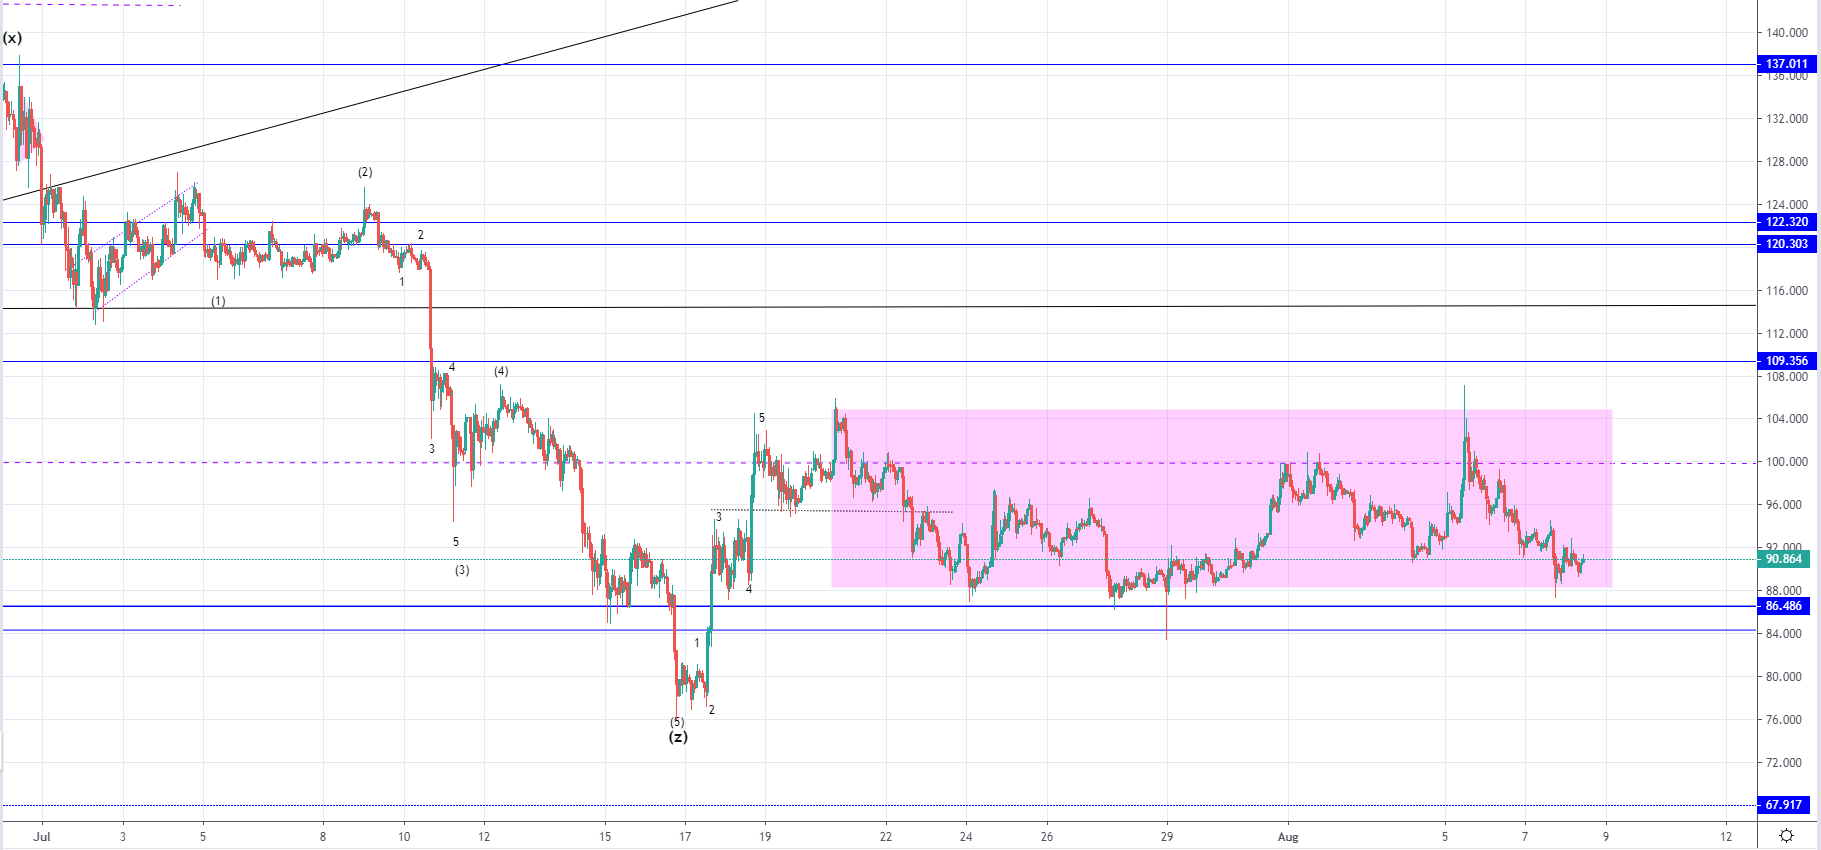
From last Monday when the price of Litecoin was sitting at $87.72 at its lowest point we have seen an increase of 16.79% as the price came up to $102.45 on this week’s Monday. The price spiked even further to the upside to 107.2 but since it attempted to exceed the prior high and entered the seller’s territory it started decreasing again. Currently, the price is being traded at $90.8 as a retracement occurred.
More likely we are seeing another corrective range after a complex correction has ended which could either be a consolidation before a proper recovery or before the downfall continues. This is why from the direction of a breakout from the horizontal range we are most likely going to see an indication of the next move’s direction but for now, a breakout to the downside looks more likely.
EOS/USD
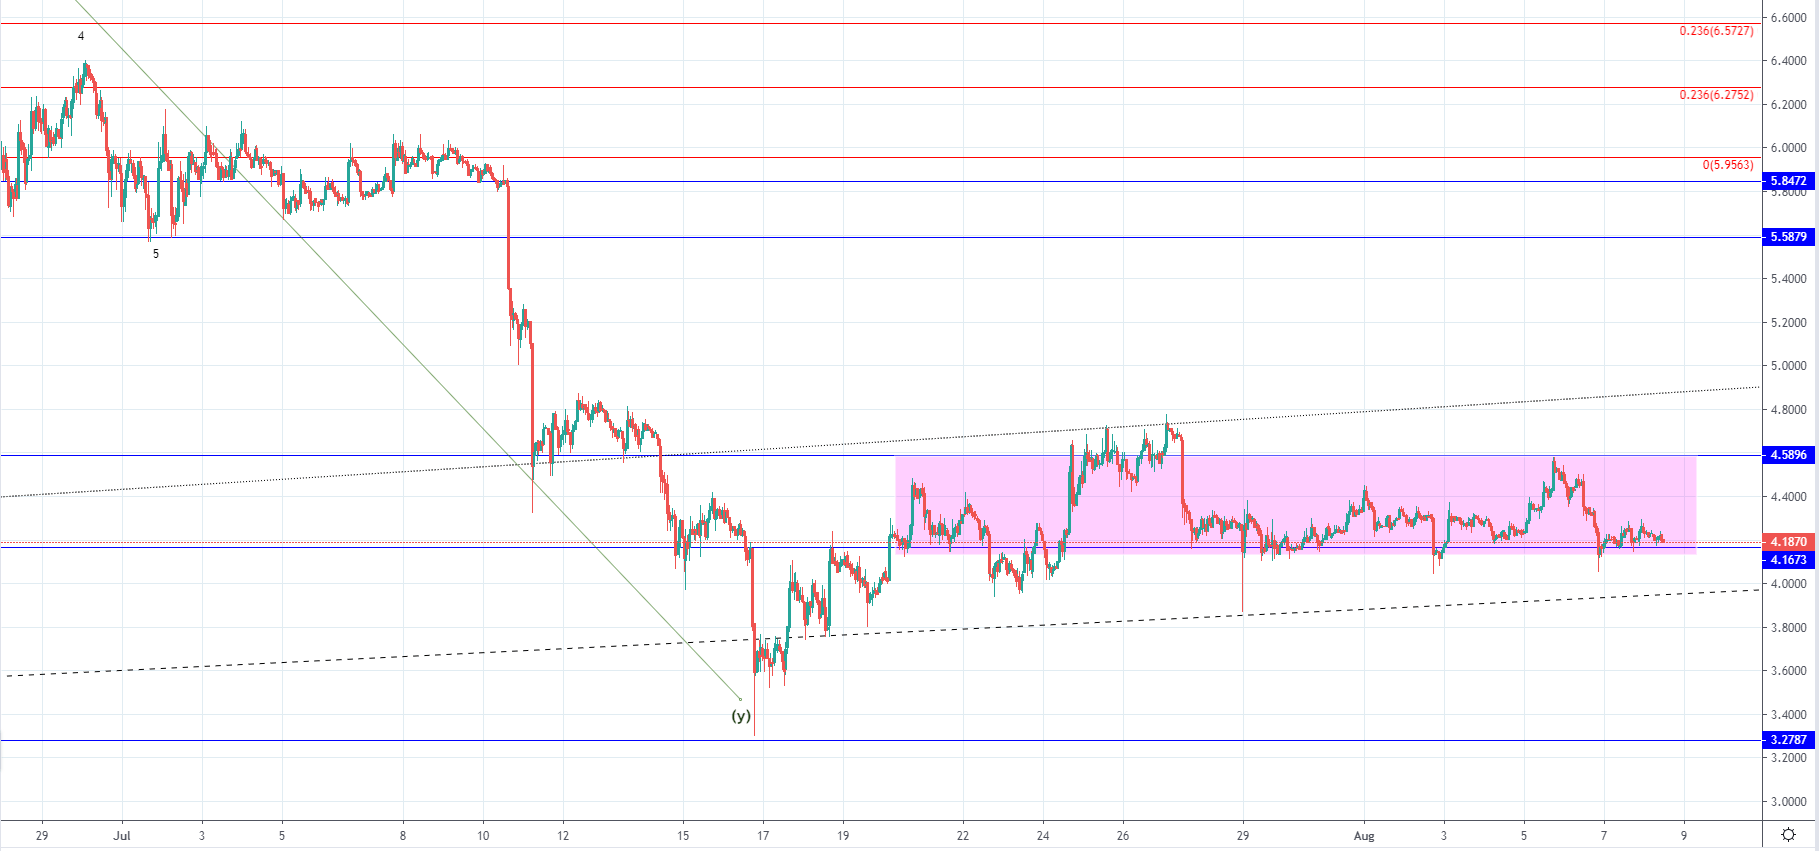
Last Monday the price of EOS was $4.133 end even spiked further to the downside reaching $3.87 at its lowest point but since then has recovered to $4.58 on Monday this week. From Monday the price started decreasing again and came down by 10% on the next day but is currently being traded at $4.187 as it’s retesting its horizontal support level.
As the price decreased in the previous period we might be seeing another attempt of recovery with the horizontal range being the 2nd wave out of the starting five-wave move to the upside, but since it took some time for the price to form the mentioned range it doesn’t look much likely. More likely we are seeing another corrective range after another downfall.