LTC and EOS: the end of the bullish period?
LTC/USD
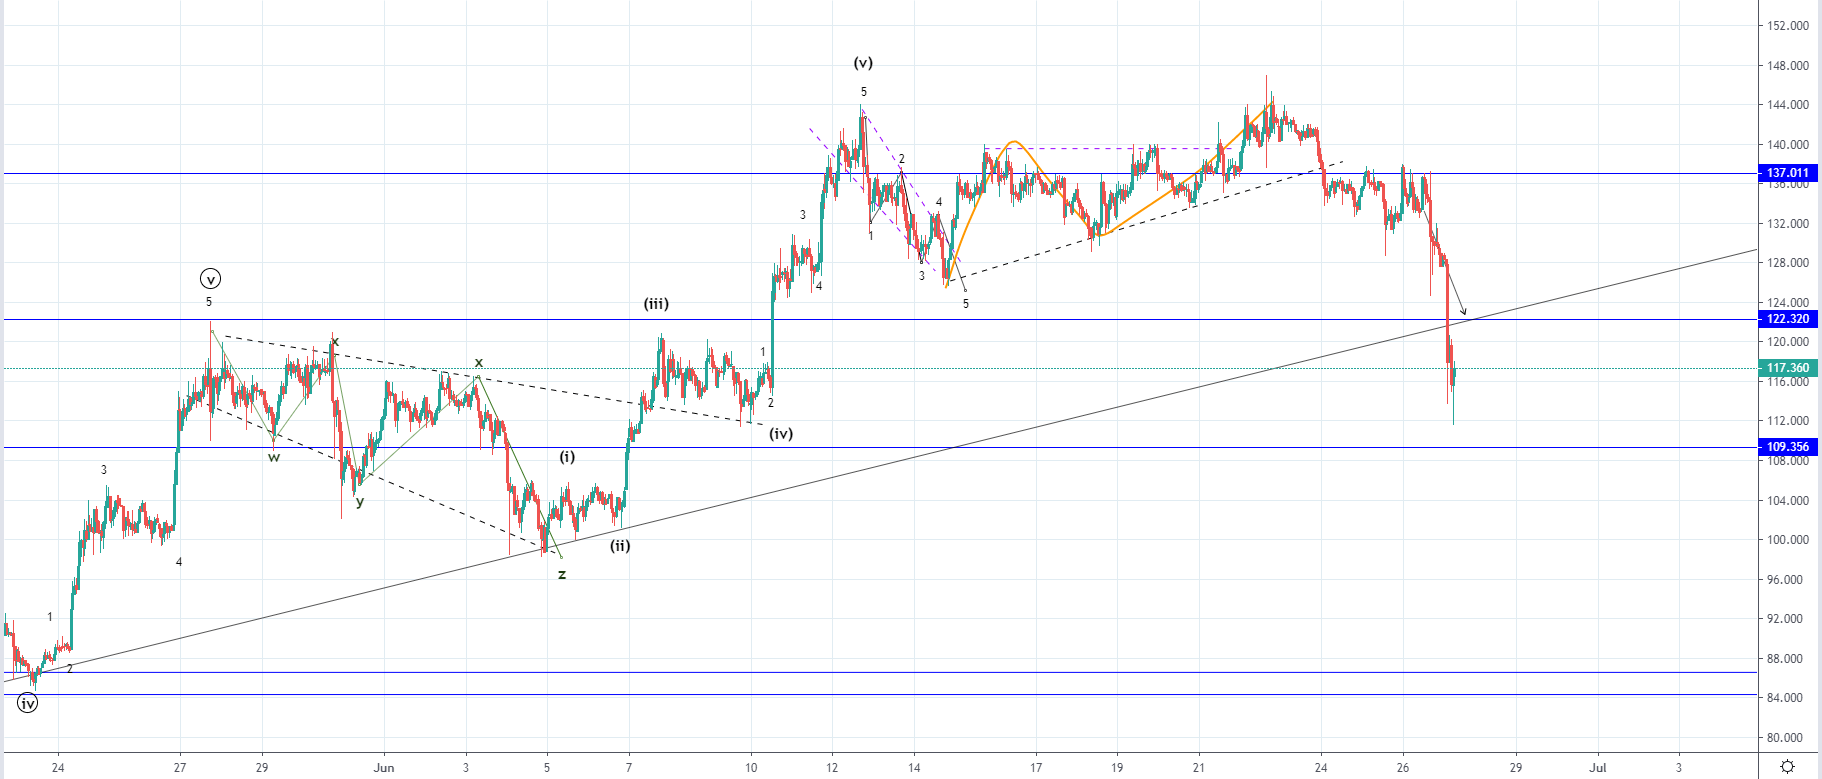
From yesterday’s open at $137.7 the price of Litecoin has decreased by 16.15% as it fell to $115.517 at its lowest point. It is currently being traded at $117.36 as it spiked to the downside inside the lower range inside the horizontal resistance area.
On the hourly chart, you can see that the momentum behind the downward move was strong, as the majority of the decrease occurred in one hour. After yesterday’s interaction with the minor horizontal resistance level ended as a rejection on the second attempt the sellers took control and pushed the price below the significant support area around the intersection of the horizontal level at $122 and the ascending trendline from 9th of May.
The price has entered the lower horizontal range below $122.32 and the highly significant pivot level at $109.356. This pivot level is the significant horizontal support in the first half of the bear market in the price of Litecoin and was the final support level out of the support zone whose median level is the $122.32 one. The next in line to the upside is at $137 which means that on a higher time scale the price came up to the broken support level which was broken on the 10th of June 2018 and retested it for resistance.
Considering that we’ve seen the ending wave to the upside and that the price was exhibited impulsiveness to the downside going below the ascending trendline and the significant horizontal support level after, I believe that we have seen the end of the bullish upswing from 29th of April. This means that a higher degree correction is now likely to push the price of Litecoin significant lower by at least 30%. The first significant support zone would be at around $83.
EOS/USD
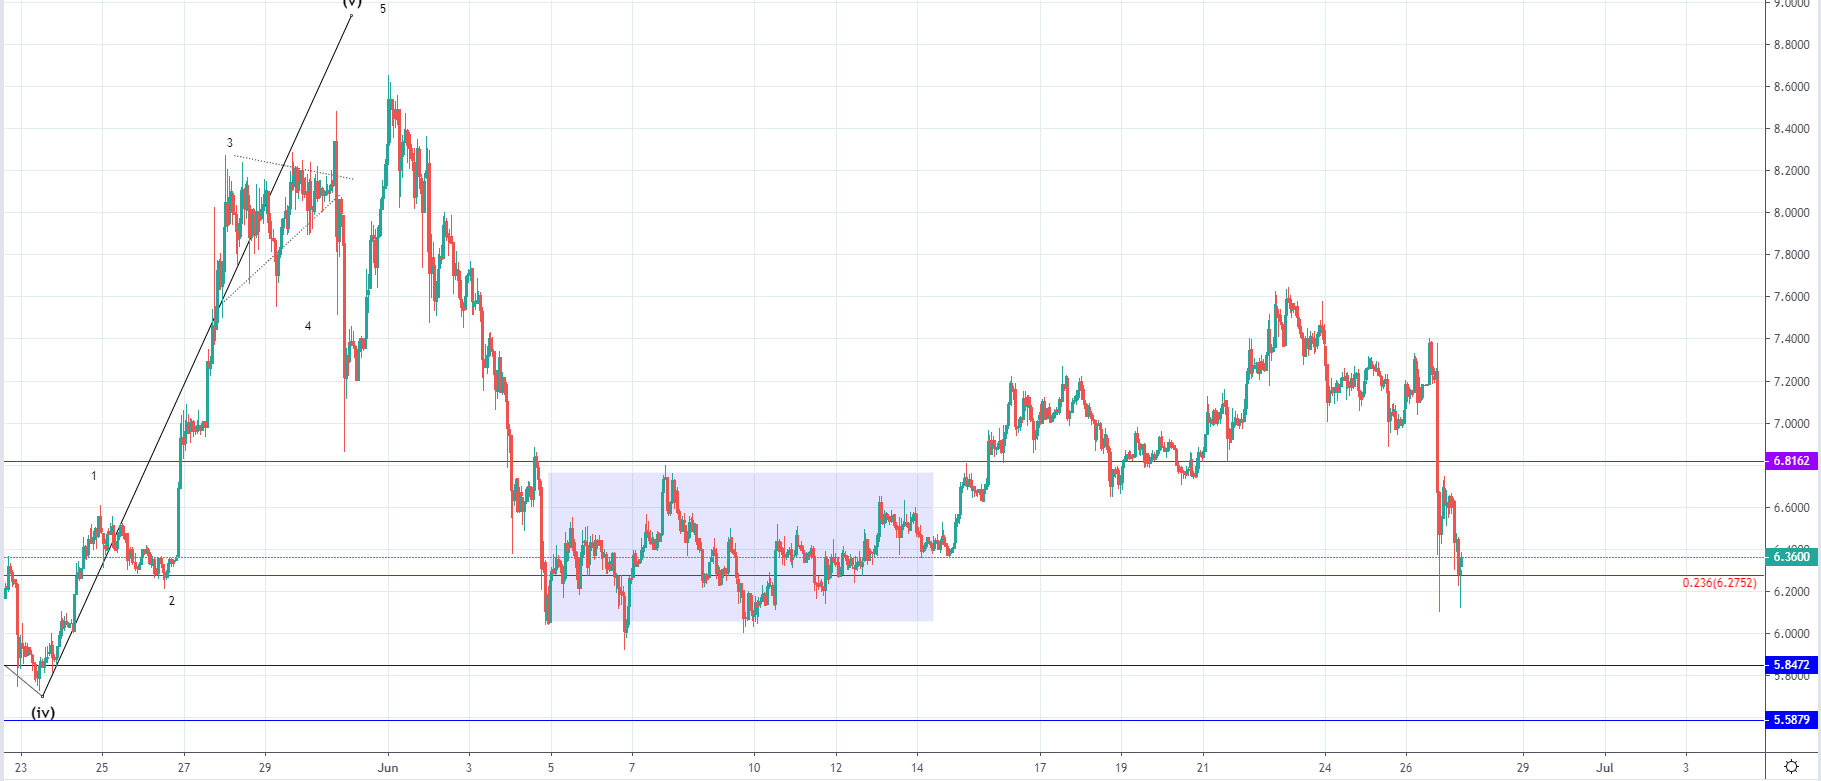
From yesterday’s high at $7.3832 the price of EOS has decreased by 15% as it came down to $6.2724 and even spiked further to the downside to $6.124 at its lowest point. The cryptocurrency is currently being traded at $6.36 as some temporary support has been found.
As you can see from the hourly chart, the price of EOS fell below the horizontal support level at $6.81 with strong momentum as the hourly candle which broke the level was 12% and was the majority of the seen decrease. After a minor recovery attempt, another collapse has been seen but the price managed to pull back up above the 0.236 Fibonacci level as the hourly candle closed above.
On the 23rd of June, we have seen the end of the upward structure which formed after an impulsive decrease. The price came to 0.618 Fibonacci level of the previous impulsive decrease on the upward recovery that followed so considering that the wave structure implies the completion of the higher degree 5th wave on the 1st of June we are now likely seeing the third wave of the correction to the downside.
If this is true then the price is set to go below the ending point of the first wave which is at $5.95. The first significant support zone on the way down would be at $5.58.