


LTC and EOS - Upward Momentum Slowing Down
FXOpen

LTC/USD
Since the start of the month, the price of Litecoin has decreased by 29.33% as it fell from $64.4 high made on September 1st to $45 area on the 4th and revisited the low level two more times after. Currently, it is being traded at around $48.5 and is in an upward trajectory but a minor retracement has been made with the price showing signs of the momentum slowing down.
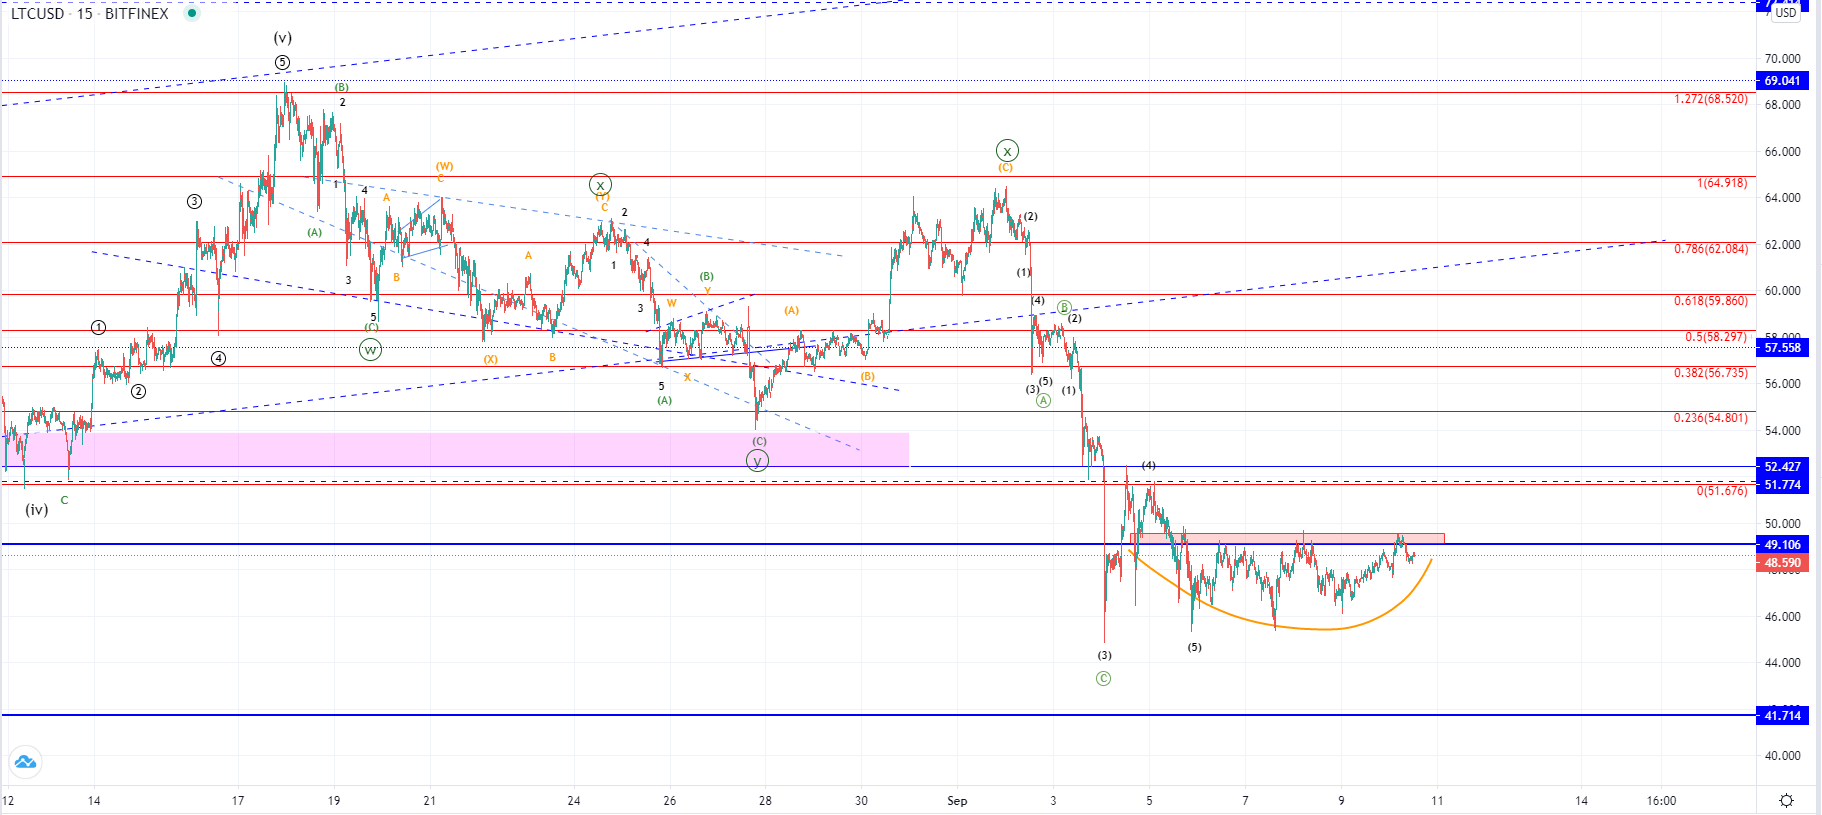
Looking at the hourly chart, you can see that the price is again retesting the horizontal resistance level at around $49.106 were it found resistance two previous times and after the interaction pulled back to the low levels made last Friday. This is a significant horizontal level and its breakout to the upside would indicate that the previous descending move that we have seen has likely ended.
From the 18th of August when the price of Litecoin came up to $69 we have seen a correction developing out of which we have seen the development of the first three-wave move followed by a connector to the upside. This could mean that the next Z wave to the downside has ended with this descending move. In that case, the U shape we are currently seeing in development could be the ending point of the correction and we are to see a breakout to the upside above the currently interacted horizontal level.
But if the impulsive move to the downside seen from the end of the month is only the first sub-wave of the next three-wave move to the downside, this U shape range might only be a consolidative B wave in which case we are going to see another rejection at the horizontal level ending with a breakout to the downside.
EOS/USD
The price of EOS has decreased by over 30% since the start of the month when it was trading at $3.554 at its highest point, measured to the lowest point made last Friday at $2.47. Since last week’s low, a significant upside spike was seen pushing the price above $3.2 level but is now being traded at around $2.75 as another descending move has been made.
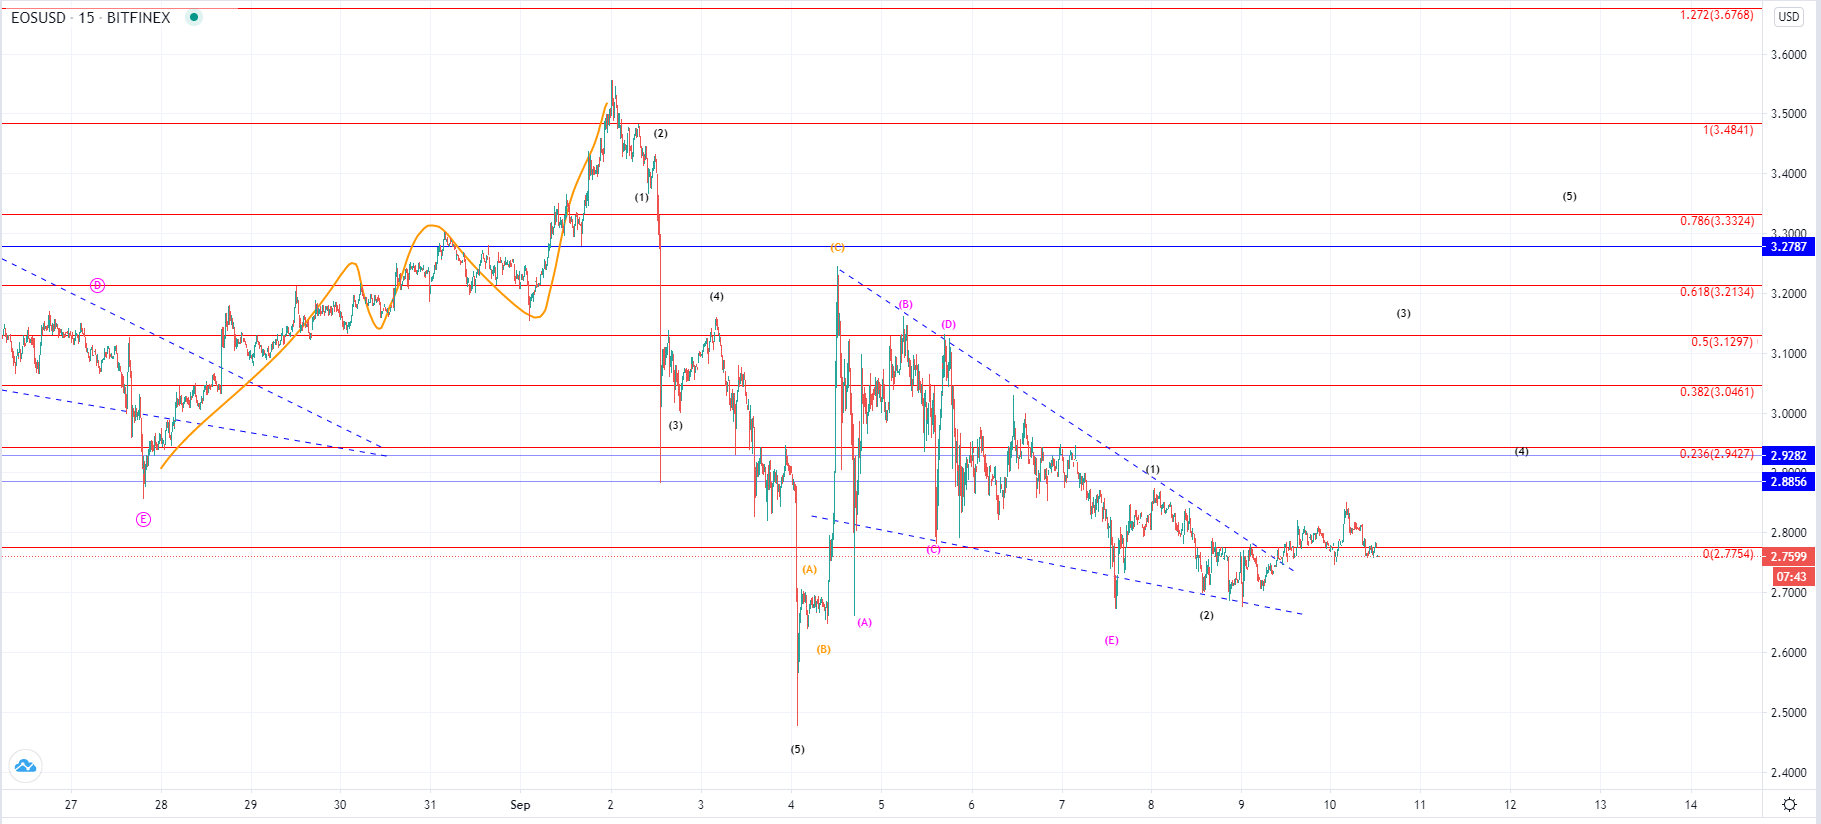
From Friday’s high at $3.239 the price continued moving to the downside again and made another five-wave triangle but managed to keep up above the $2.68 level which was tested on Monday and again yesterday. With the price finding support there an ascending move has been made with a breakout from the descending triangle, but the price is struggling to keep up the bullish momentum above the 0 Fib level below which is currently being traded again.
If we have seen the completion of the ABCDE correction on Monday’s low the next move that followed could be another impulsive move to the upside out of which we are currently seeing the development of the 3rd wave. In that case, the price could continue increasing to its next horizontal resistance level potentially around $2.88 when it might get rejected, causing another downturn.
FXOpen offers the world's most popular cryptocurrency CFDs*, including Bitcoin and Ethereum. Floating spreads, 1:2 leverage — at your service (additional fees may apply). Open your trading account now or learn more about crypto CFD trading with FXOpen.
*Important: At FXOpen UK, Cryptocurrency trading via CFDs is only available to our Professional clients. They are not available for trading by Retail clients. To find out more information about how this may affect you, please get in touch with our team.
This article represents the opinion of the Companies operating under the FXOpen brand only. It is not to be construed as an offer, solicitation, or recommendation with respect to products and services provided by the Companies operating under the FXOpen brand, nor is it to be considered financial advice.
Stay ahead of the market!
Subscribe now to our mailing list and receive the latest market news and insights delivered directly to your inbox.


Latest articles

Amazon Earnings: Does the Chart Already Know Something the Numbers Don't?
All eyes are on July 30, when Amazon reports Q2 2026 earnings, with Wall Street increasingly convinced the bar has been set too low. Consensus sees EPS near $1.82-$2.26 on roughly $197 billion in revenue, but the

WTI Analysis: Gap Breaks Short-Term Trend as Price Remains Trapped Between the POC and Profile Boundary
WTI crude oil plunged by more than 7% on 27 July 2026 after the US suspended a series of strikes against Iran over the weekend, raising hopes of a diplomatic solution and the reopening of shipping through the Strait of

US Dollar Index: A Defining Week for the King of the Markets
The dollar heads into a pivotal week trading near 101.80, just off a 15-month high, with the Fed's July 29 meeting standing as the clear focal point. Markets currently price roughly a 65% chance of a hold, though renewed