LTC/USD and EOS/USD in a corrective stage
LTC/USD
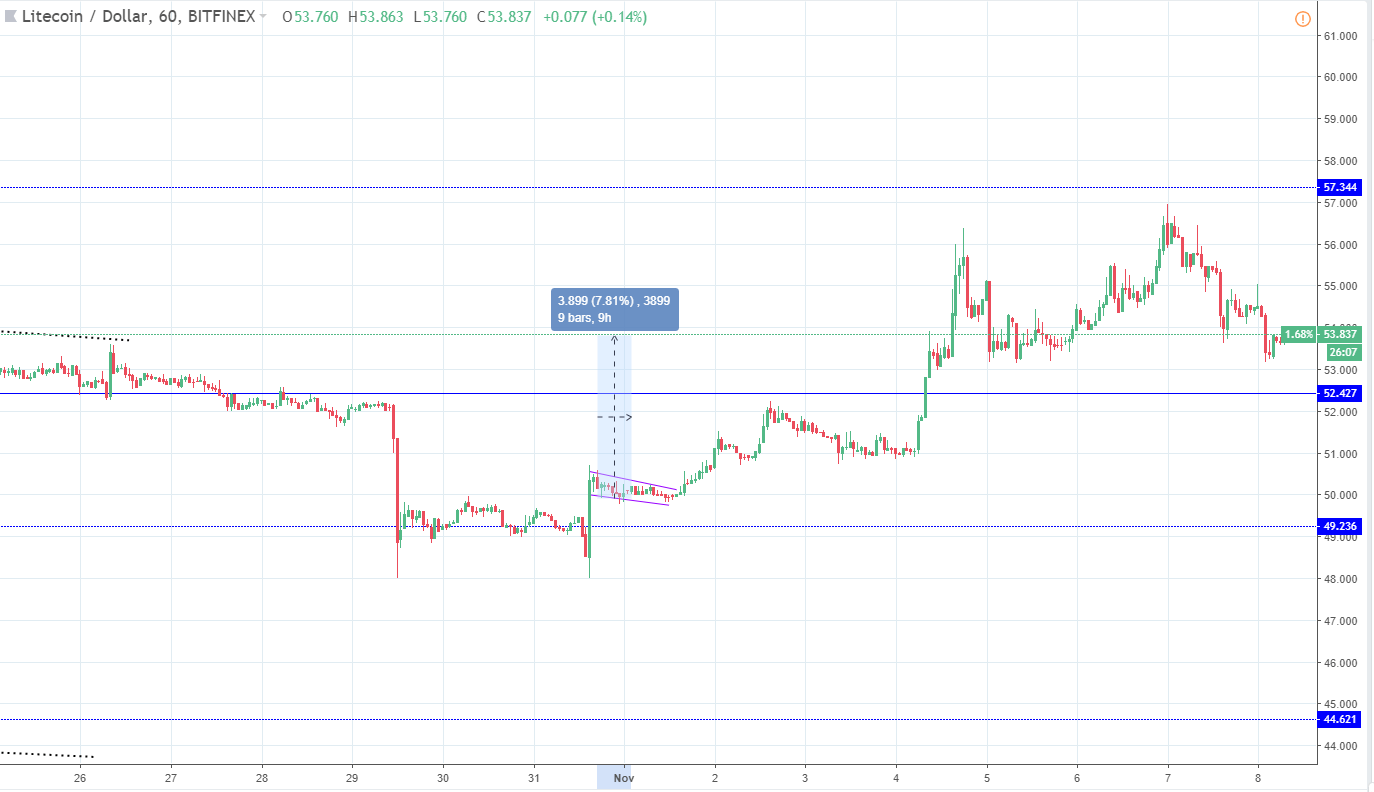
Since the last week’s analysis on 1th of November, the price of Litecoin has increased by 7.81% measured from the open at $49.88 to the levels the cryptocurrency is currently being traded at $53.83.
As you can see from the hourly chart above, the price went even further up to the $56.443 level, slightly below the significant horizontal resistance level at $57.344. This is the R1 from the support zone range, which is better seen on the 4-hour chart below.
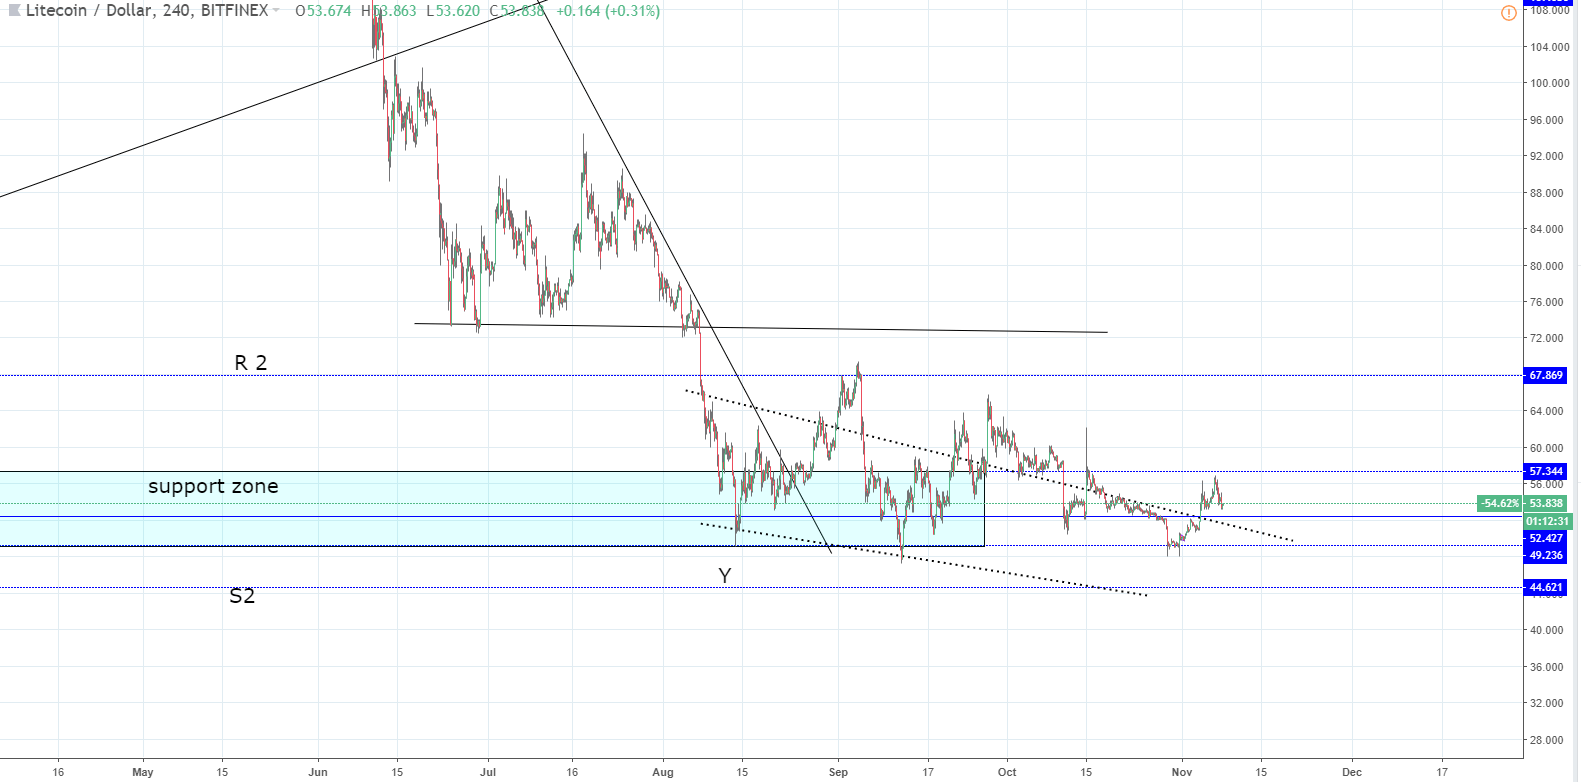
After the Y wave ended we saw an ascending structure ending at first on the R2, which turned out to be a descending one. It is likely heading towards S2 now as the current upward structure resembles the first one. It resulted in a lower low and as the prior one was at the S1 from the support zone, a lower low would be at around $44.6.
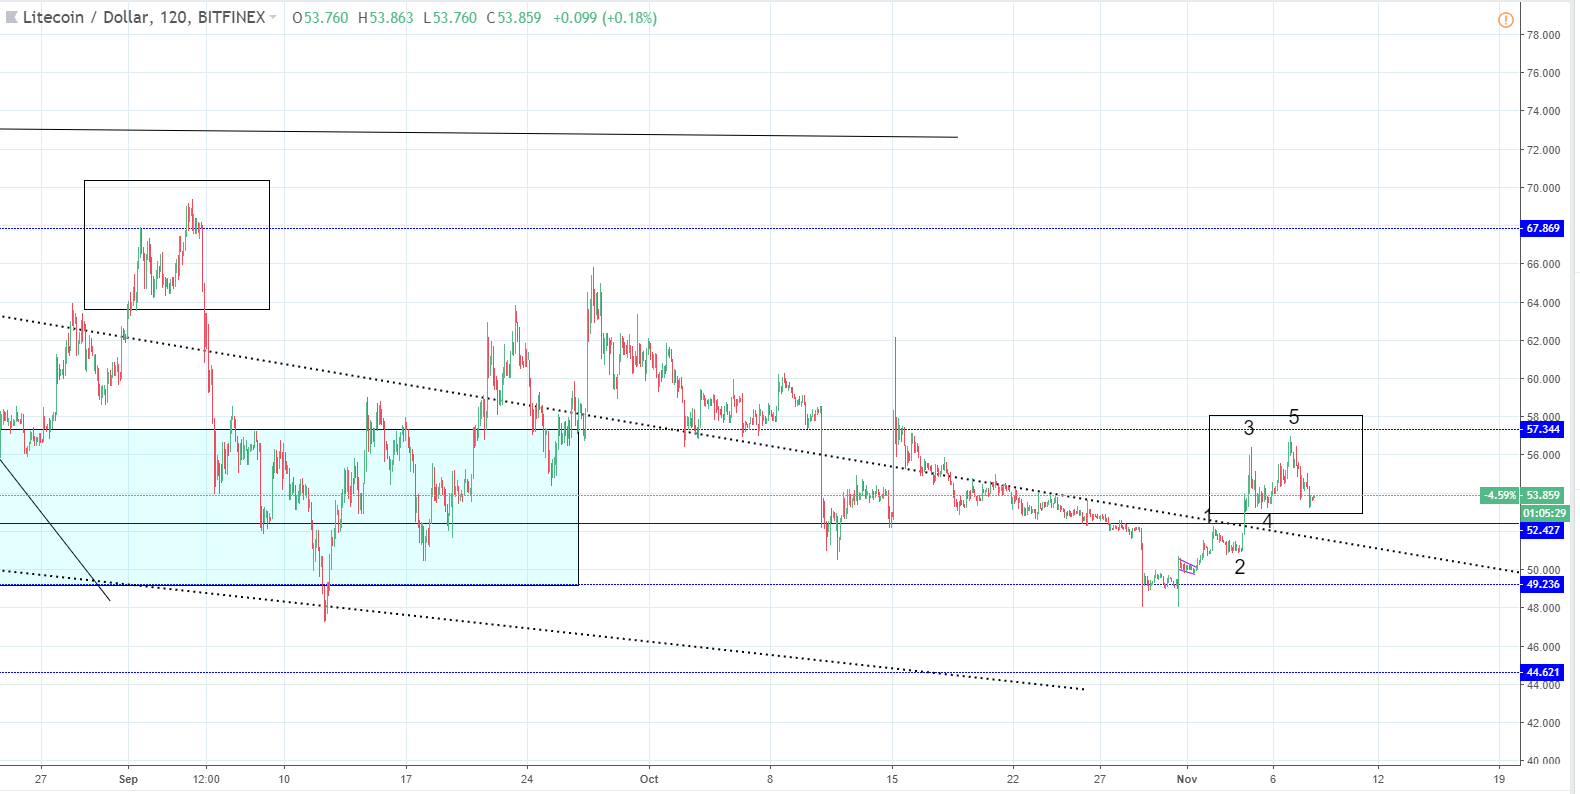
Zooming in a bit into the 2-hour chart, I have labeled the similar data points with the rectangle in order to assess the similarity. As you can see I have counted the motive waves and the impulsive 12345 has been completed after which a correction occurred.
We might see another increase after this correction ends but I believe that the price has topped out temporarily and has formed a lower high. Hence, the price is going to form a lower low as the descending structure is still in play.
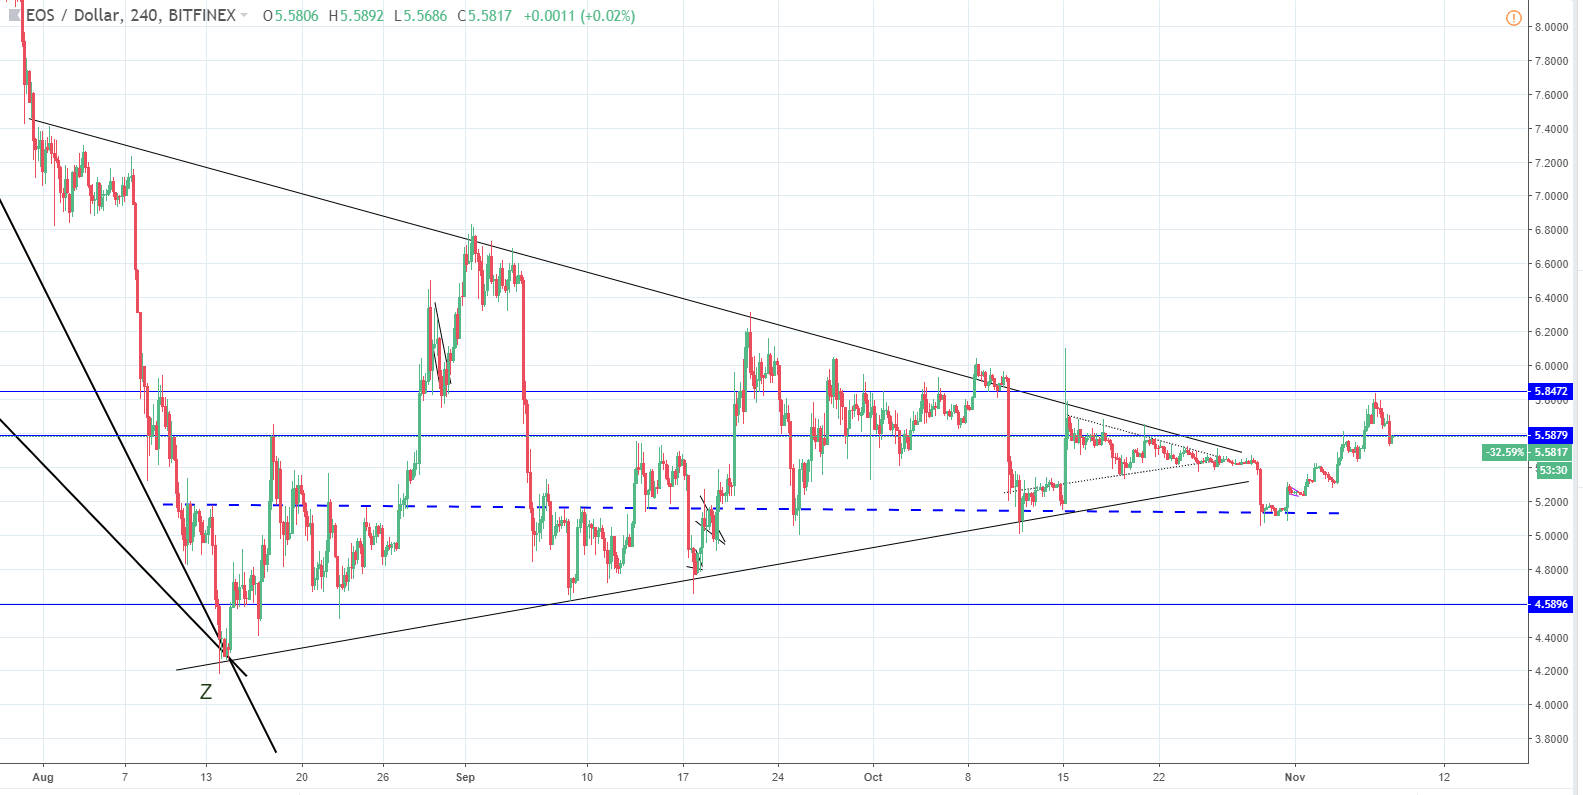
EOS/USD
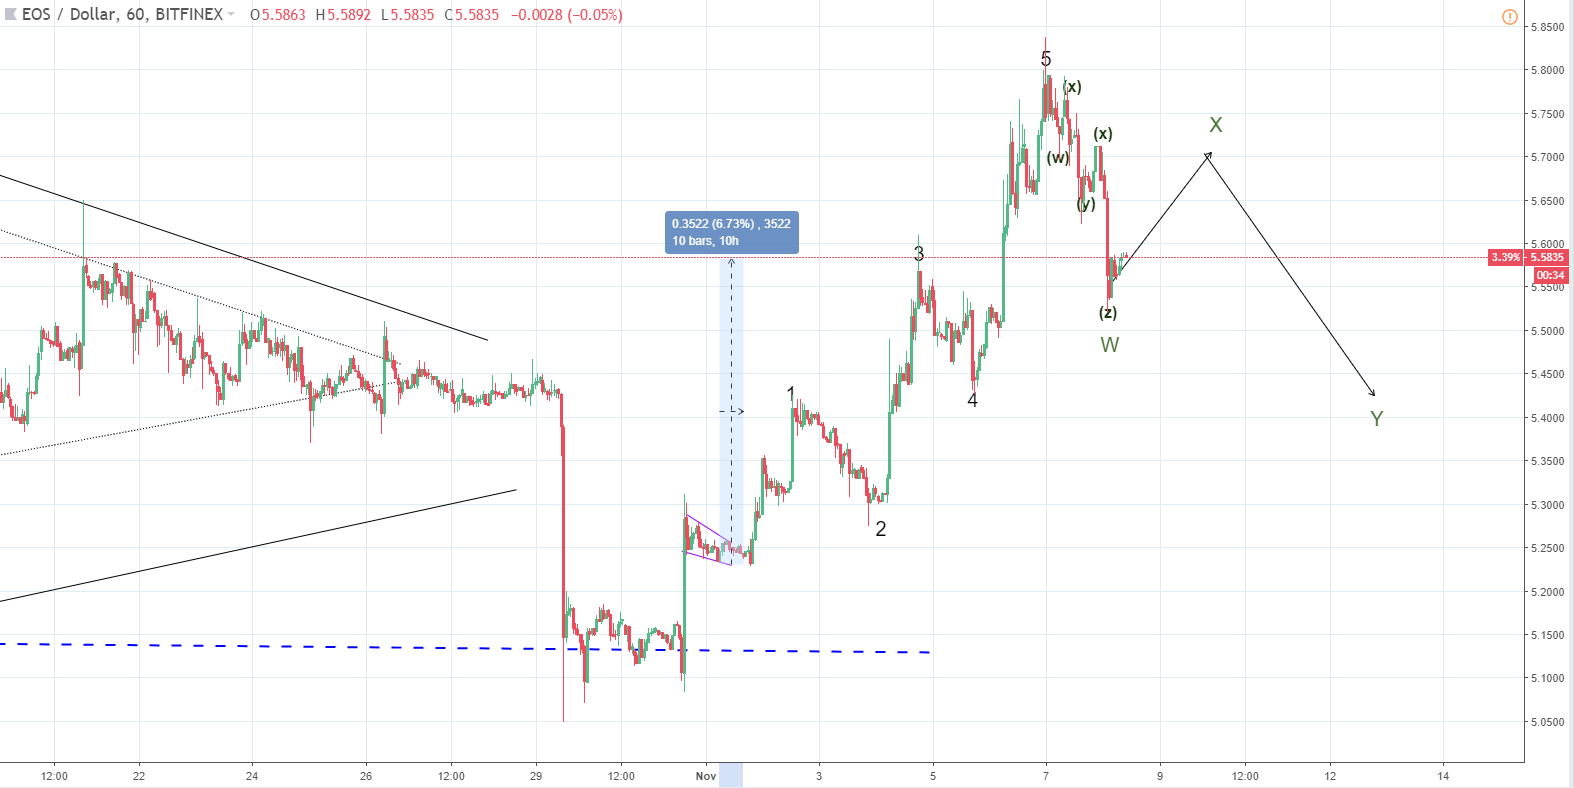
Since last Thursday when the price of EOS was at around $5.22 the cryptocurrency has experienced an increase of 6.73% measured to the current level of $5.579.
Looking at the hourly chart above you can see a similar chart pattern like in the case of LTC as the market is strongly correlated. According to my wave count, like in the case of LTC, the 12345 impulse wave has ended as we are currently seeing a correction playing out. The first part of the correction has also ended on the minute WXYXZ, which I believed would be the W wave from a minor three wave WXY correction.
Zooming out to the 4-hour chart we can see that the price is currently interacting with the minor range horizontal resistance level. The interaction is playing out from below, which means that the price is looking and retesting it for resistance once again.
As this level isn’t that respected but is only a standing point between the next horizontal level at $5.87 and the prior one, we are now likely going to see the price going above it once again but only to around $5.677 before going below it once again as the projected WXY correction will push the price lower if that scenario proves to be valid.
Both pairs are in their corrective stages and it is still unclear how they would play out – an aggressive downfall or a classical three wave Zigzag type. The next major market move can’t conclusively be called out before the end, as the aggressiveness of the downfall and the target price would determine the projection.
If this 12345 impulse wave that we have seen in the previous week was a five wave recovery to the upside, then this current correction could also be a five-wave move to the downside pushing the price potentially lower than from where the increase happened.
If, however, the impulse wave was motive and in the case of EOS a breakout from the descending triangle than more upside should be expected in the upcoming period as the current correction could only be a minor stop on the three wave before another motive wave occures.