LTC/USD and EOS/USD: Is the bullish period over?
LTC/USD
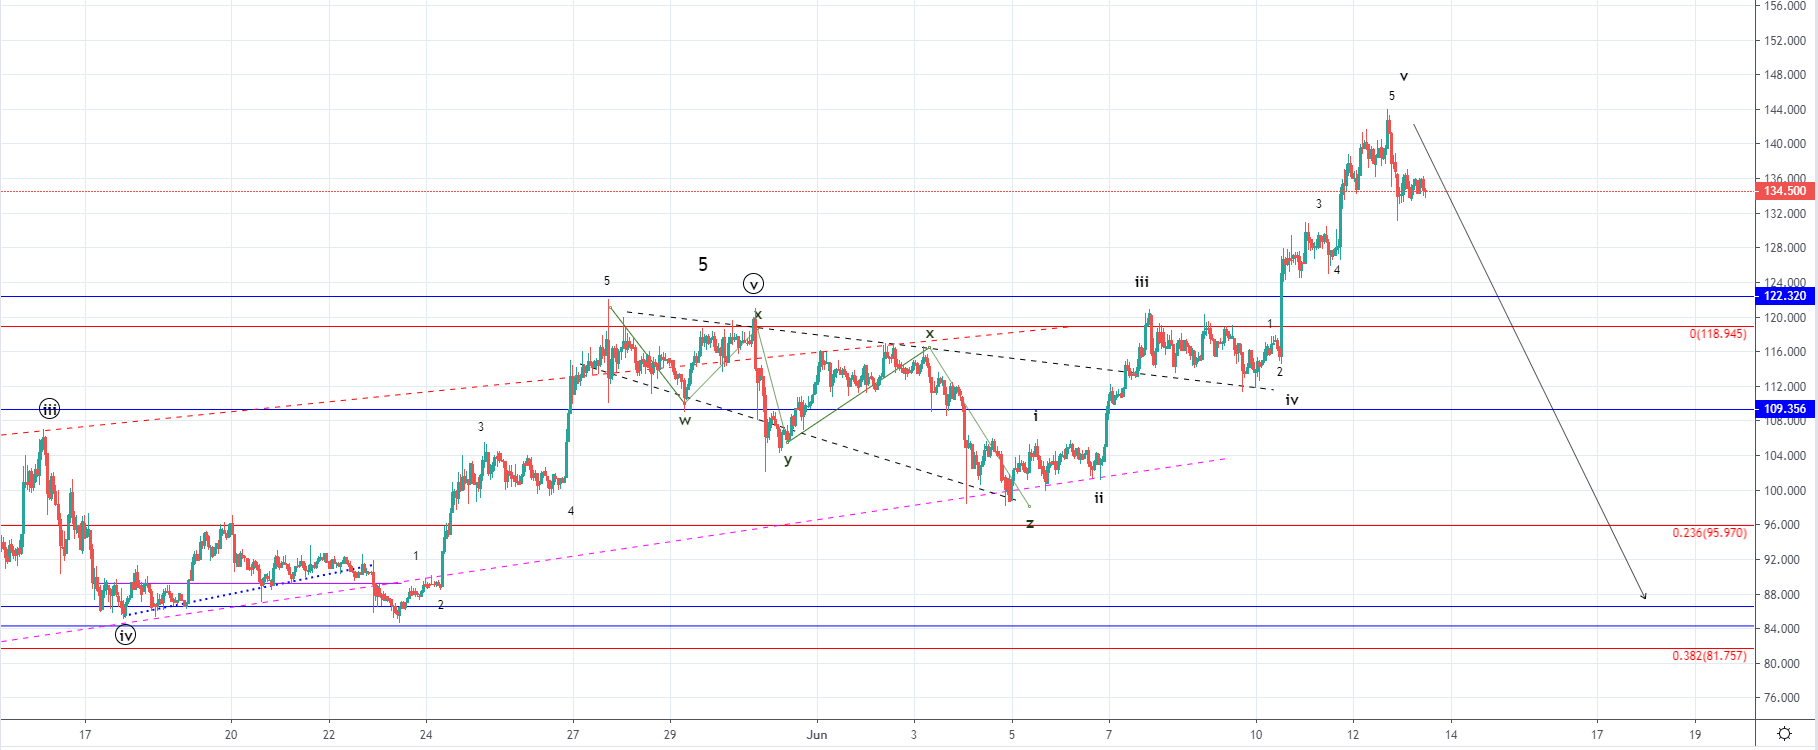
From Monday’s open at $113.554 the price of Litecoin has increased by 25.66% as it came up to $142.68 at its highest point today. Since then the price has fallen by around 6% and is currently being traded at $134.73 with the price action forming a horizontal cluster.
On the hourly chart, you can see that since Monday we have seen an increase in a five-wave manner which has pushed the price above some of the significant resistance points. The first major resistance broken was at the prior high at around $118.94 while the next one was at $122.32 above which it is considered to be the sellers’ territory. As the price made a five-wave increase which is most likely the 5th wave from the impulse wave of the higher degree which started on the 5th of June we have likely seen its completion.
The price has entered the territory above the significant horizontal level at $122.32 which is considered to be the upper level of the resistance zone above which is the sellers’ territory. Since the price moved impulsively the momentum was enough for a breakout but the price hasn’t come down to some of the broken resistance levels for a retest of support before it continued moving to the upside further which makes the rise more unsustainable.
Considering that we have seen the completion of the five-wave increase and that the price has entered the seller’s territory we are now likely to see a move to the downside. The move to the downside might have already started as the price decreased impulsively and started forming a horizontal cluster. I would be expecting the price to go at least to some of the broken resistance points for a retest of support, but if we have seen the completion of the Minor count five-wave impulse the price would continue moving further to the downside back inside the territory of the lower range with the first strong support zone being at around $83.
EOS/USD
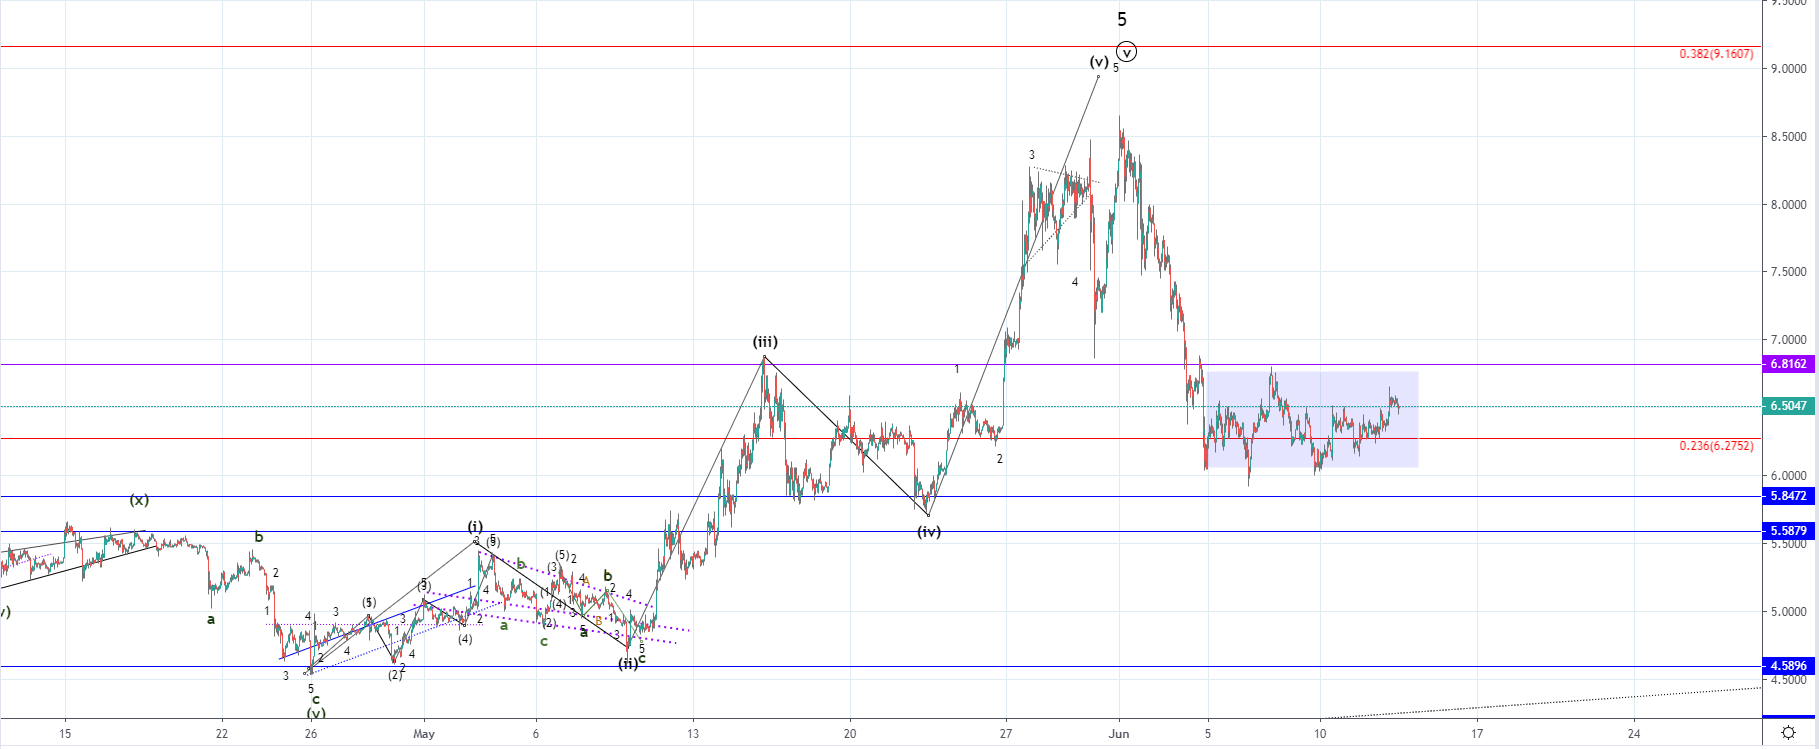
From Monday the price of EOS has been on the rise and has made an increase of 9.75% coming from $6.04 to $6.63 at its highest point today. The price has started showing signs of weakness slightly below the prior high and is starting to move to the downside again, currently being traded at around $6.5.
On the hourly chart, we can see that the price action formed a horizontal range after a downfall of over 29% which started since the beginning of June. The range has been formed below the significant horizontal level at $6.816 and the 0.236 Fibonacci level which serves as a pivot point. The price moved below the Fib level but managed to pull back above quickly after which indicates that the buyers and the sellers are consolidating with unclear sing of control over the price.
As we’ve seen the completion of the five-wave impulse to the upside of a higher Minor degree a downfall of 29% could have been the first impulsive wave out of the downward move which was expected to play out as a starting downtrend. If the downtrend started this horizontal range would be its second wave which is corrective in nature and could lead the price back above the significant horizontal level at $6.816 before another downturn.
Another possibility would be that the decrease of 29% was another correction before the uptrend continuation but considering that the price of EOS was in a bullish period in which it recovered by over 415% from 7th of December last year I believe that more likely we are going to see further downside as a correction of the same degree in which case the first significant support zone would be at around $4.3